Blog
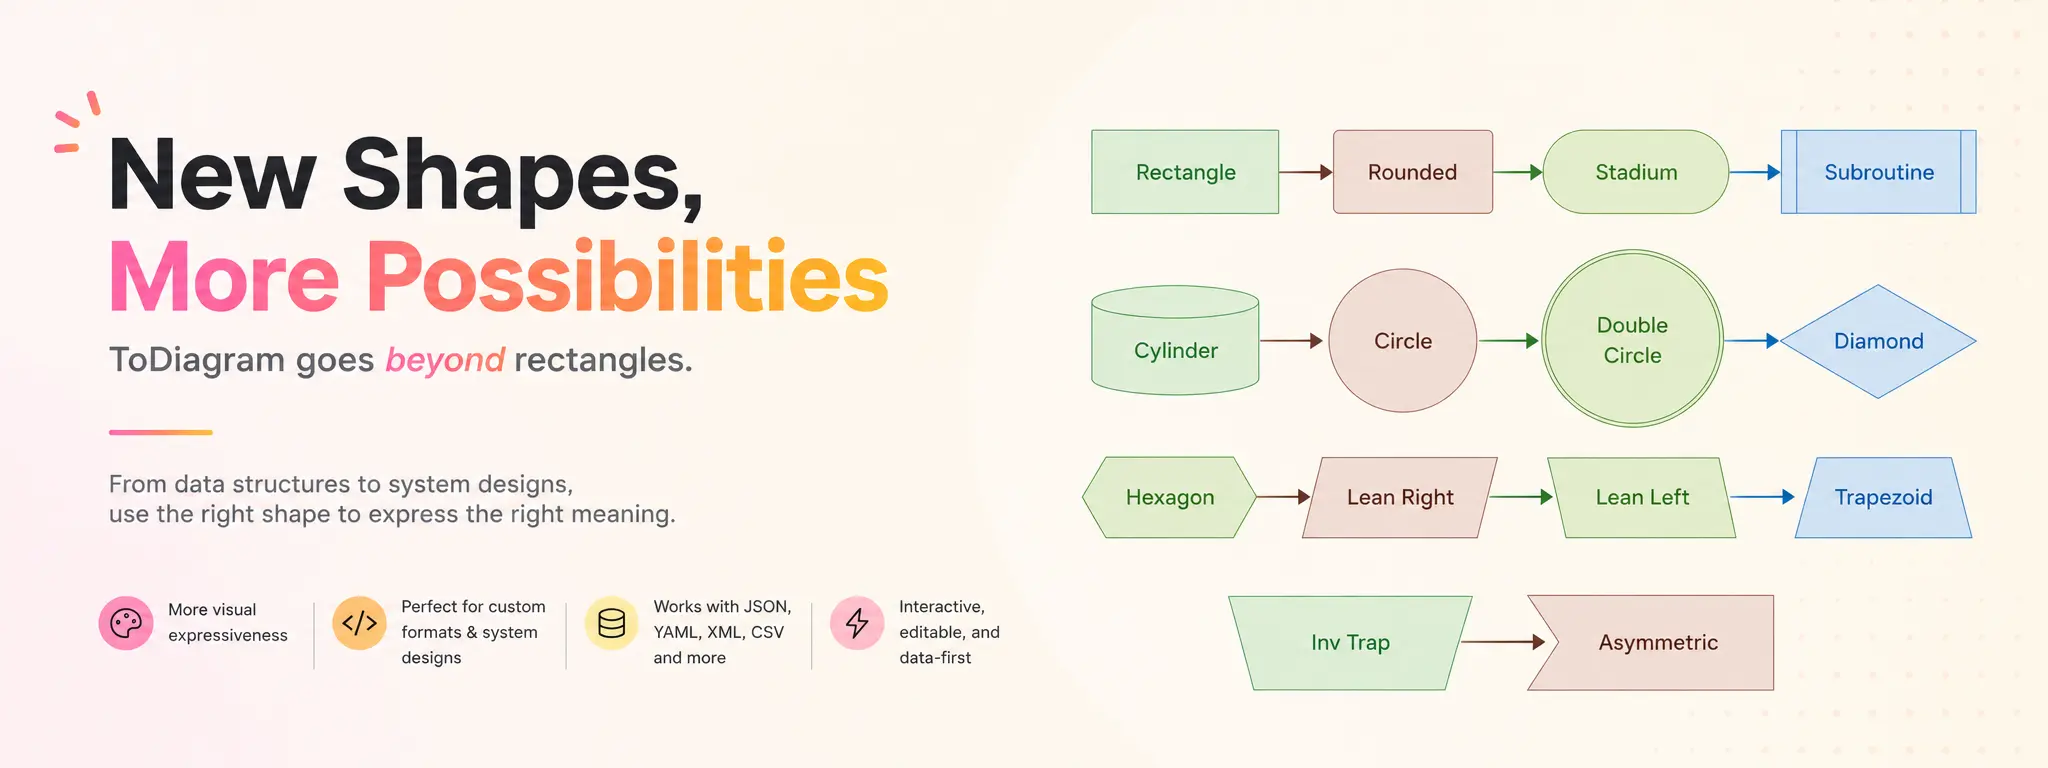
Introducing New Shapes in ToDiagram
ToDiagram now supports more node shapes for Mermaid and custom diagrams, including diamonds, cylinders, circles, hexagons, parallelograms, trapezoids, and more.

Visualize Pull Requests as Diagrams
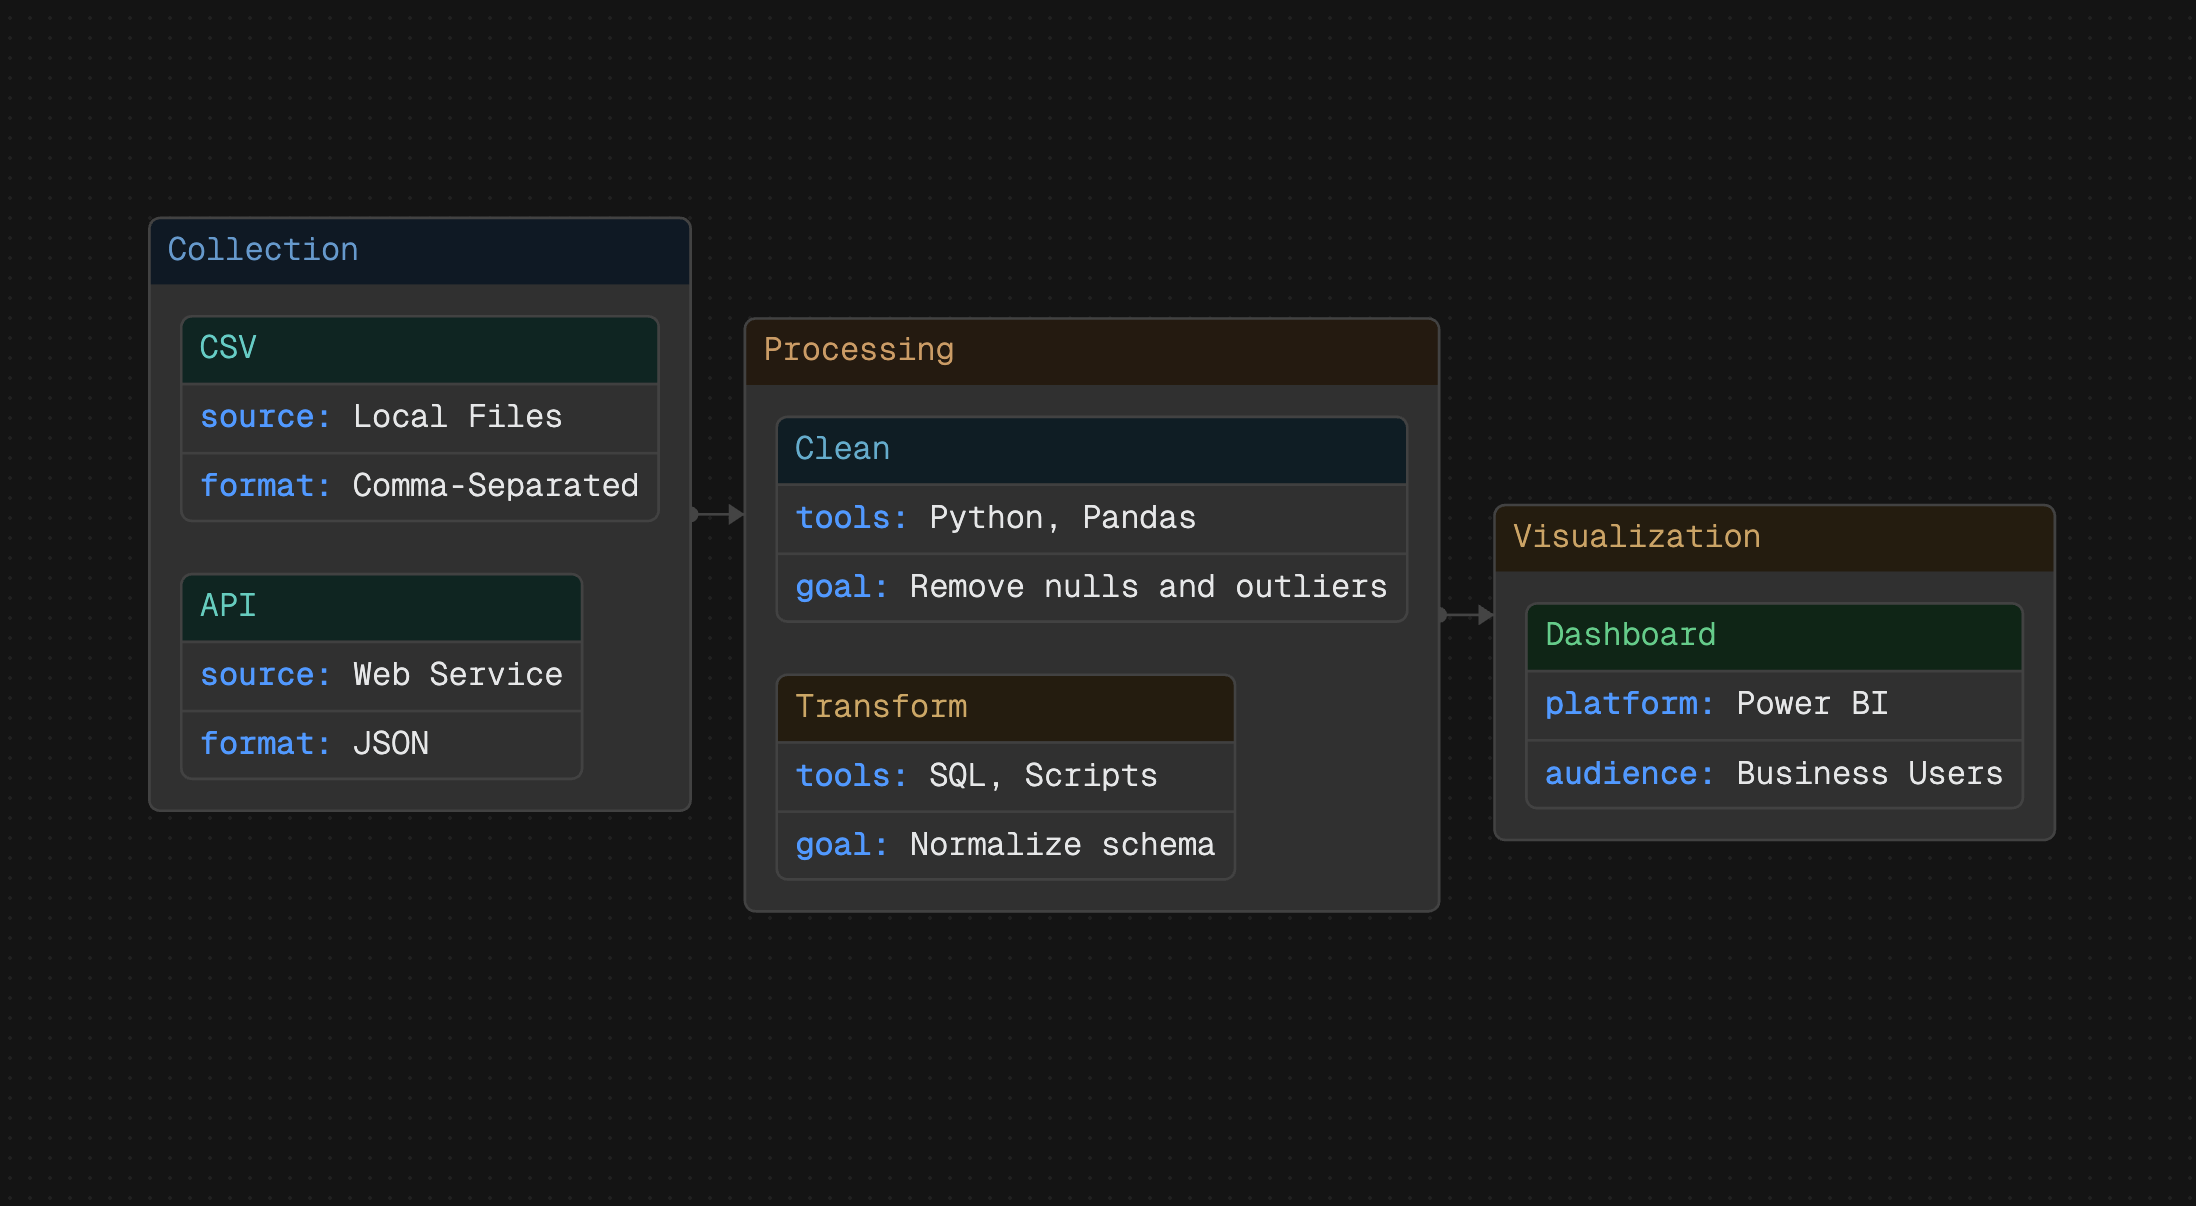
Large pull requests hide structural changes across scattered diffs. Instead of mentally reconstructing the system, let an LLM explain the PR as a diagram and review the shape of the change before reading the code.
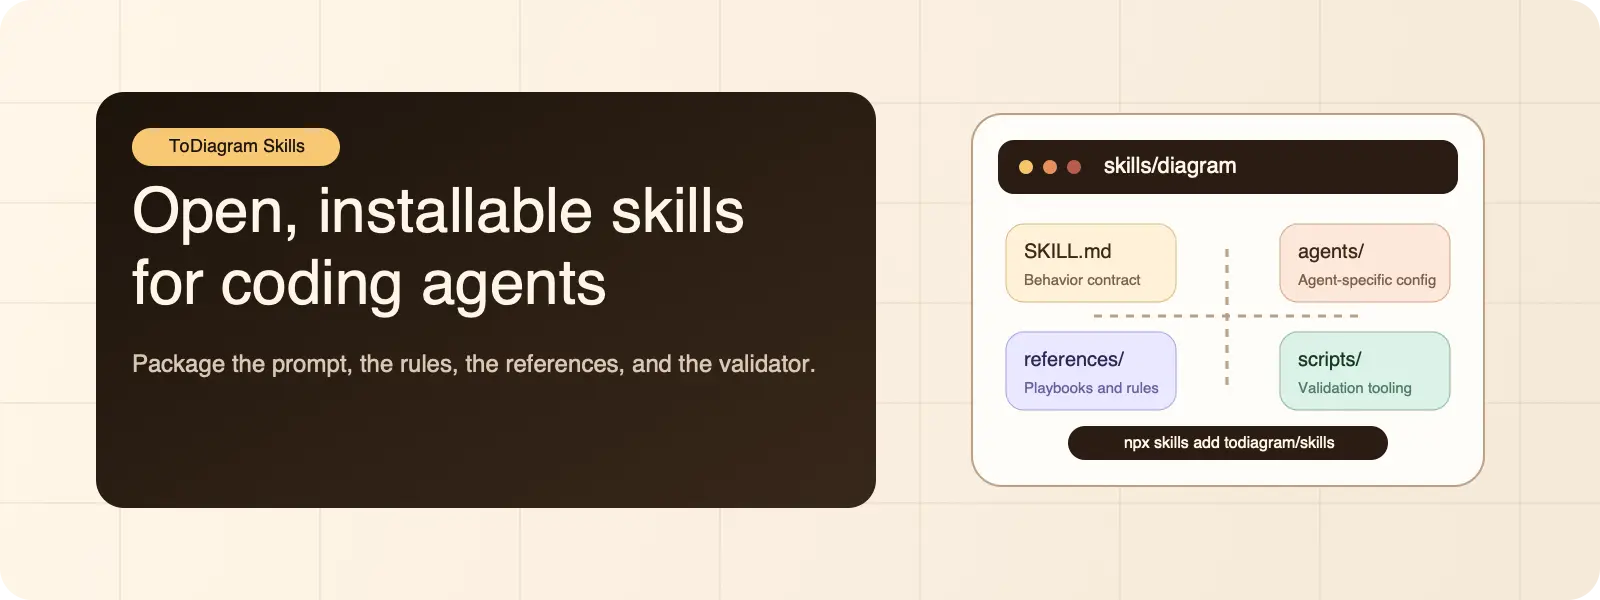
Introducing ToDiagram Skills for Coding Agents
ToDiagram Skills is a public repository of installable agent skills. The first published `diagram` skill helps coding agents create clearer diagrams for architecture, flows, and AI-generated diffs.

Visualize XSD Schemas Across Multiple Files
Link multiple XSD files in ToDiagram to visualize cross-file type relationships, inheritance, and composition in a single unified diagram.

Introducing Mermaid Sequence Diagrams
ToDiagram now supports Mermaid Sequence Diagrams. This post introduces the feature and shows how to start using it.

Introducing Animated Diagrams
Learn how Animated Diagrams in ToDiagram helps teams explain complex flows faster, reduce cognitive overload, and run clearer architecture reviews.
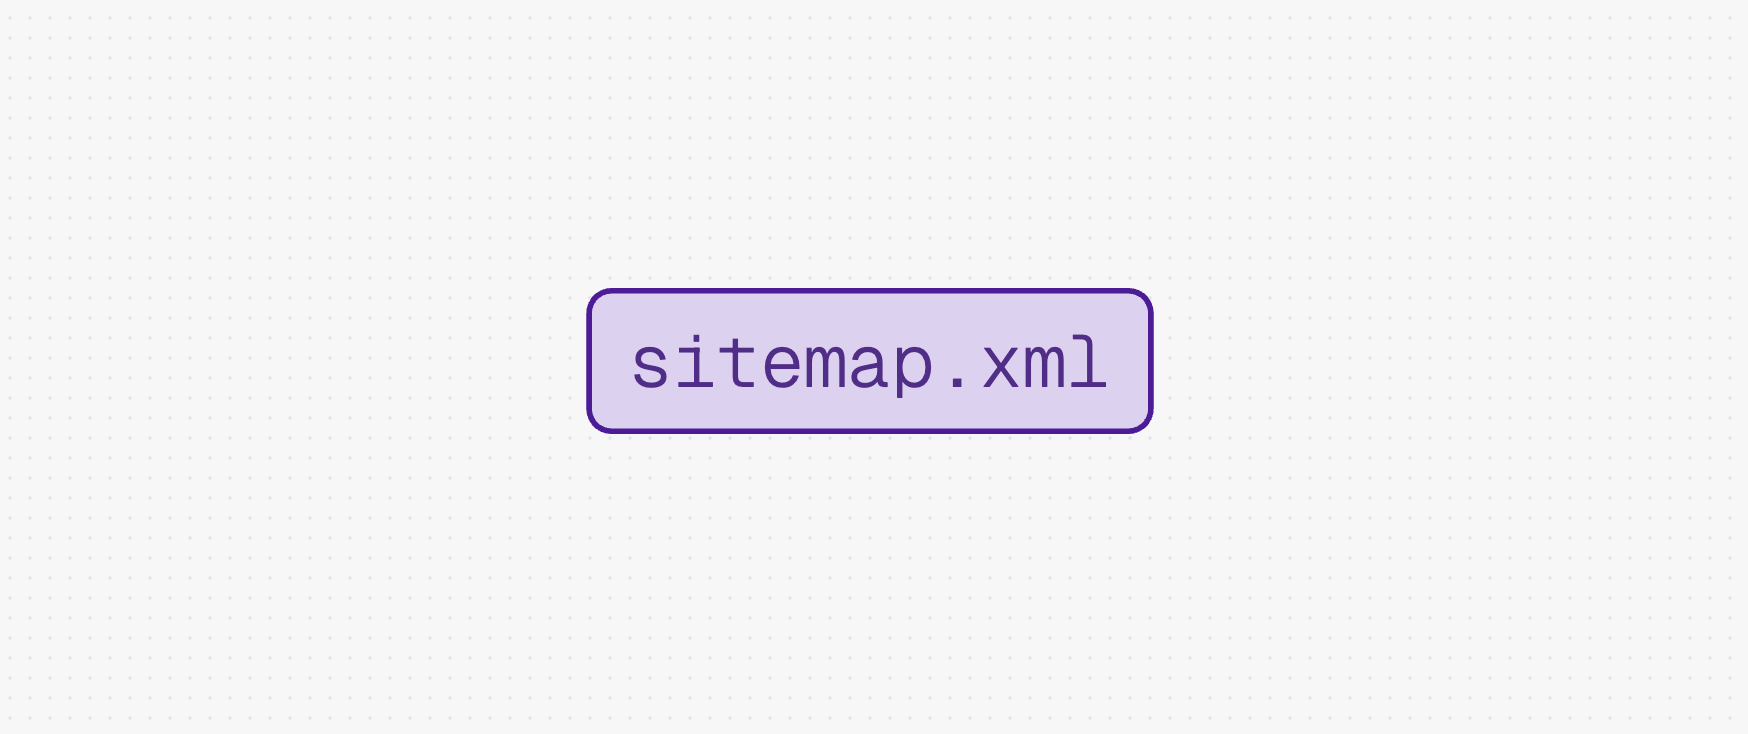
Visualizing Sitemaps as Diagrams
Turn sitemap.xml into a clear, interactive diagram to audit site structure, surface gaps, and share SEO insights fast.
ToDiagram 🤝 GitHub Education
ToDiagram is now part of the GitHub Student Developer Pack, giving students free access to powerful data visualization tools.
How to Build Custom Diagrams in ToDiagram
Learn how to define and visualize domain-specific data models using ToDiagram's Custom format, with configurable keys and nested structures.

Validate JSON Schema Right on the Diagrams
Validate JSON Schema visually with real-time feedback on interactive diagrams. Find and fix errors faster with schema-aware editing in ToDiagram.
Mastering jq: 10 Practical Commands to Transform and Query JSON Efficiently
Learn how to query, filter, and transform JSON data efficiently with jq. This guide covers 10 practical jq commands with clear examples you'll actually use in real projects.
PlantUML vs. ToDiagram - Which Diagram Tool Fits Your Workflow?
PlantUML and ToDiagram both offer ways to visualize JSON, but they take very different approaches. This blog compares their strengths and limitations, helping you decide whether a text-based or interactive editor is better for your workflow.
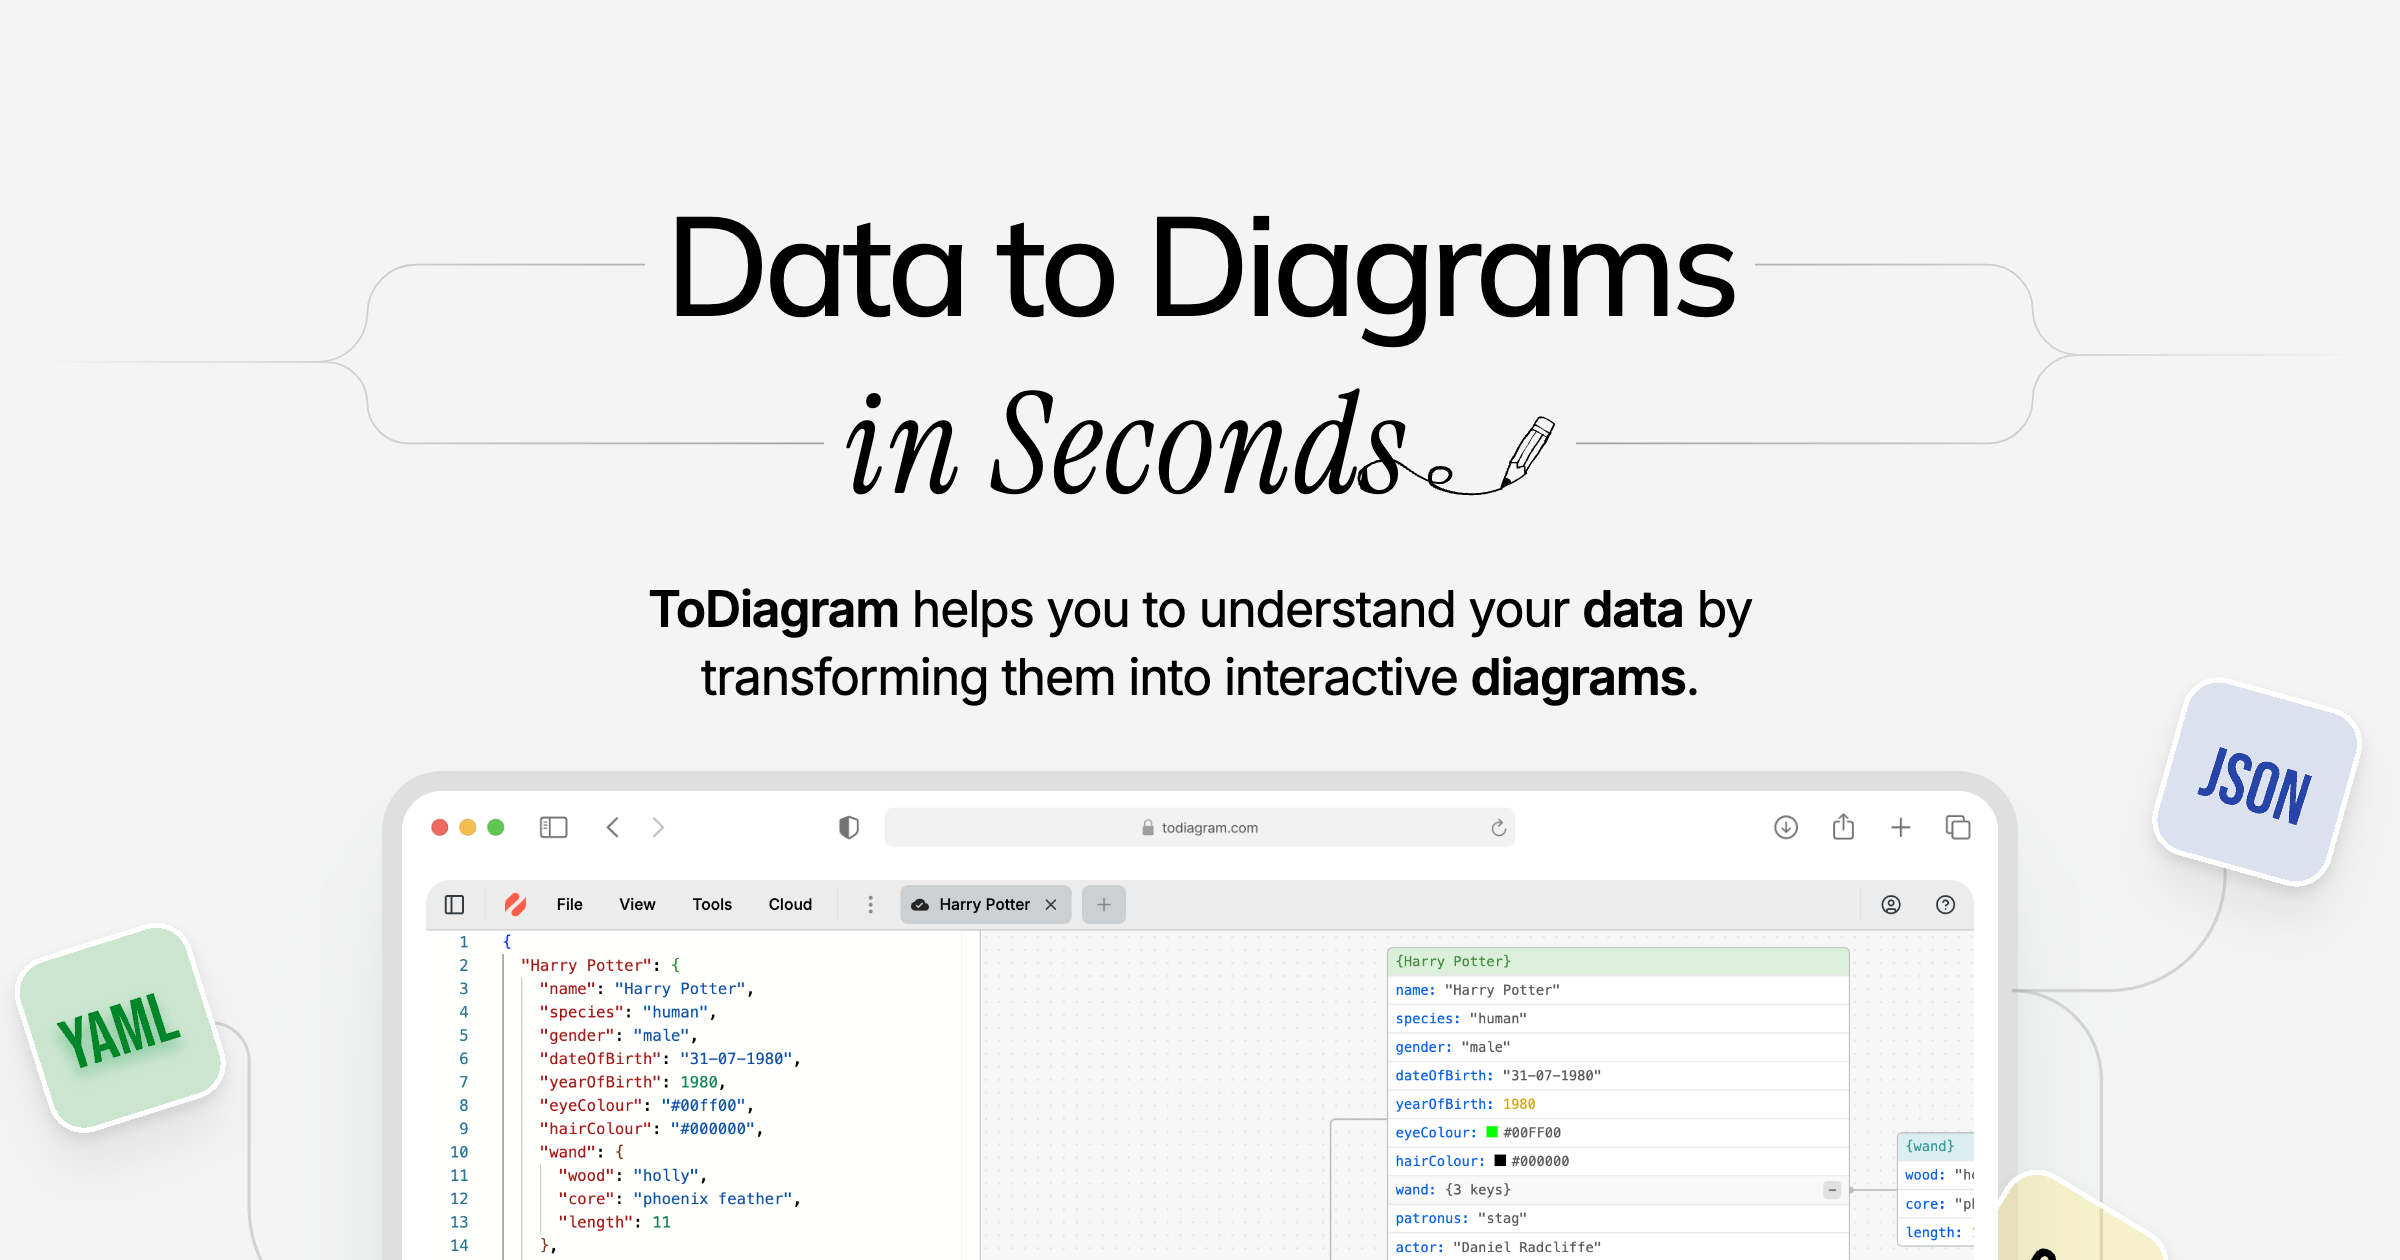
Data Visualization with ToDiagram: JSON, YAML, CSV and XML
Learn why ToDiagram is the preferred tool for visualizing complex data structures.
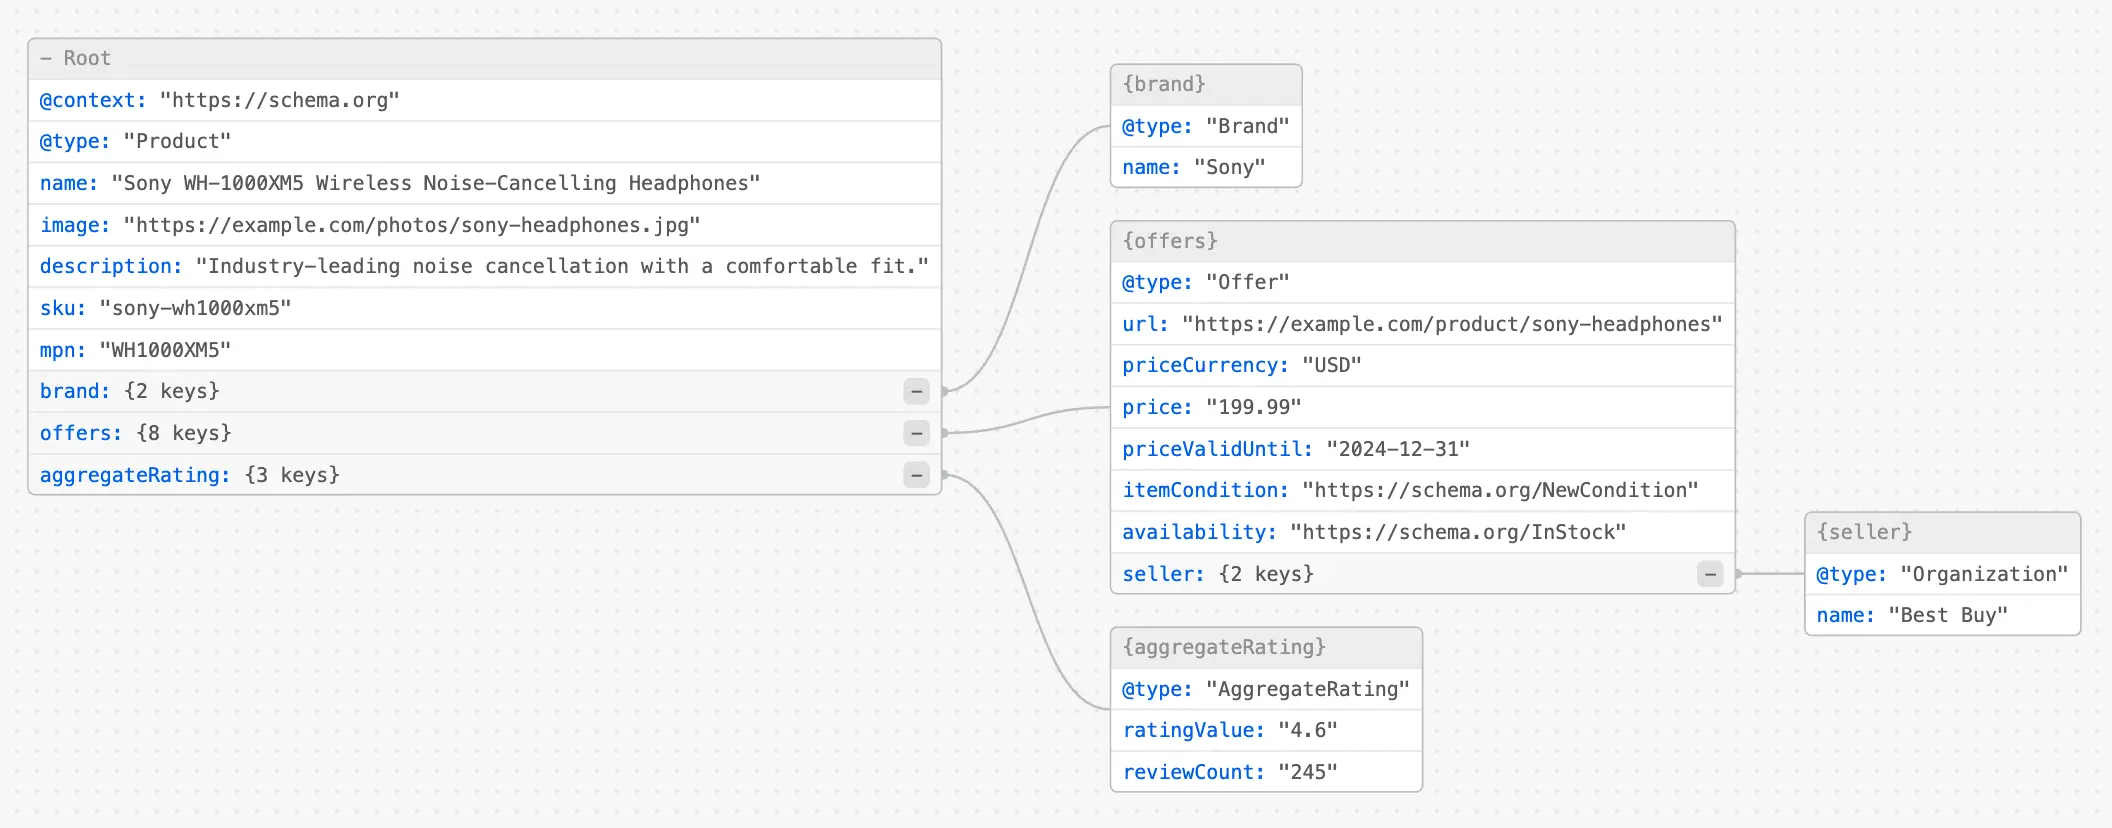
How Visualizing JSON-LD Can Boost Your SEO Strategy
Discover how JSON-LD visualization simplifies SEO workflows and improves site performance.