How Visualizing JSON-LD Can Boost Your SEO Strategy
Aykut Saraç
• September 21, 2024
As search engines evolve, structured data like JSON-LD (JavaScript Object Notation for Linked Data) has become critical for helping Google and other platforms better understand and rank your content. However, dealing with JSON-LD code can be cumbersome for SEO professionals who often lack a technical background. ToDiagram offers a solution by visualizing this data into clear, interactive diagrams. This article will explain how visualizing JSON-LD helps streamline SEO workflows and enhance site performance.
1. Why JSON-LD Matters in SEO
JSON-LD is a lightweight, easy-to-read format for structuring data on websites. It enables search engines to parse content better, resulting in rich snippets, improved rankings, and more visibility in SERPs (Search Engine Results Pages). But reading and editing raw JSON-LD can be intimidating, especially for non-developers.
Challenges SEO Professionals Face:
- Understanding nested data structures.
- Ensuring data accuracy without breaking the schema.
- Quickly identifying errors.
2. How ToDiagram Simplifies JSON-LD
ToDiagram transforms complex JSON-LD structures into intuitive, interactive diagrams. Instead of parsing through dense lines of code, SEO professionals can see how their structured data is connected and flows within the diagram.
Benefits of Diagramming JSON-LD:
- Clear Visualization: It visually represents the relationships between entities, making it easier to comprehend at a glance.
- Faster Debugging: Spot errors or missing fields faster, reducing the time spent manually looking for mistakes in the code.
- Simplified Collaboration: SEO teams can better communicate structured data issues with developers, enhancing collaboration.
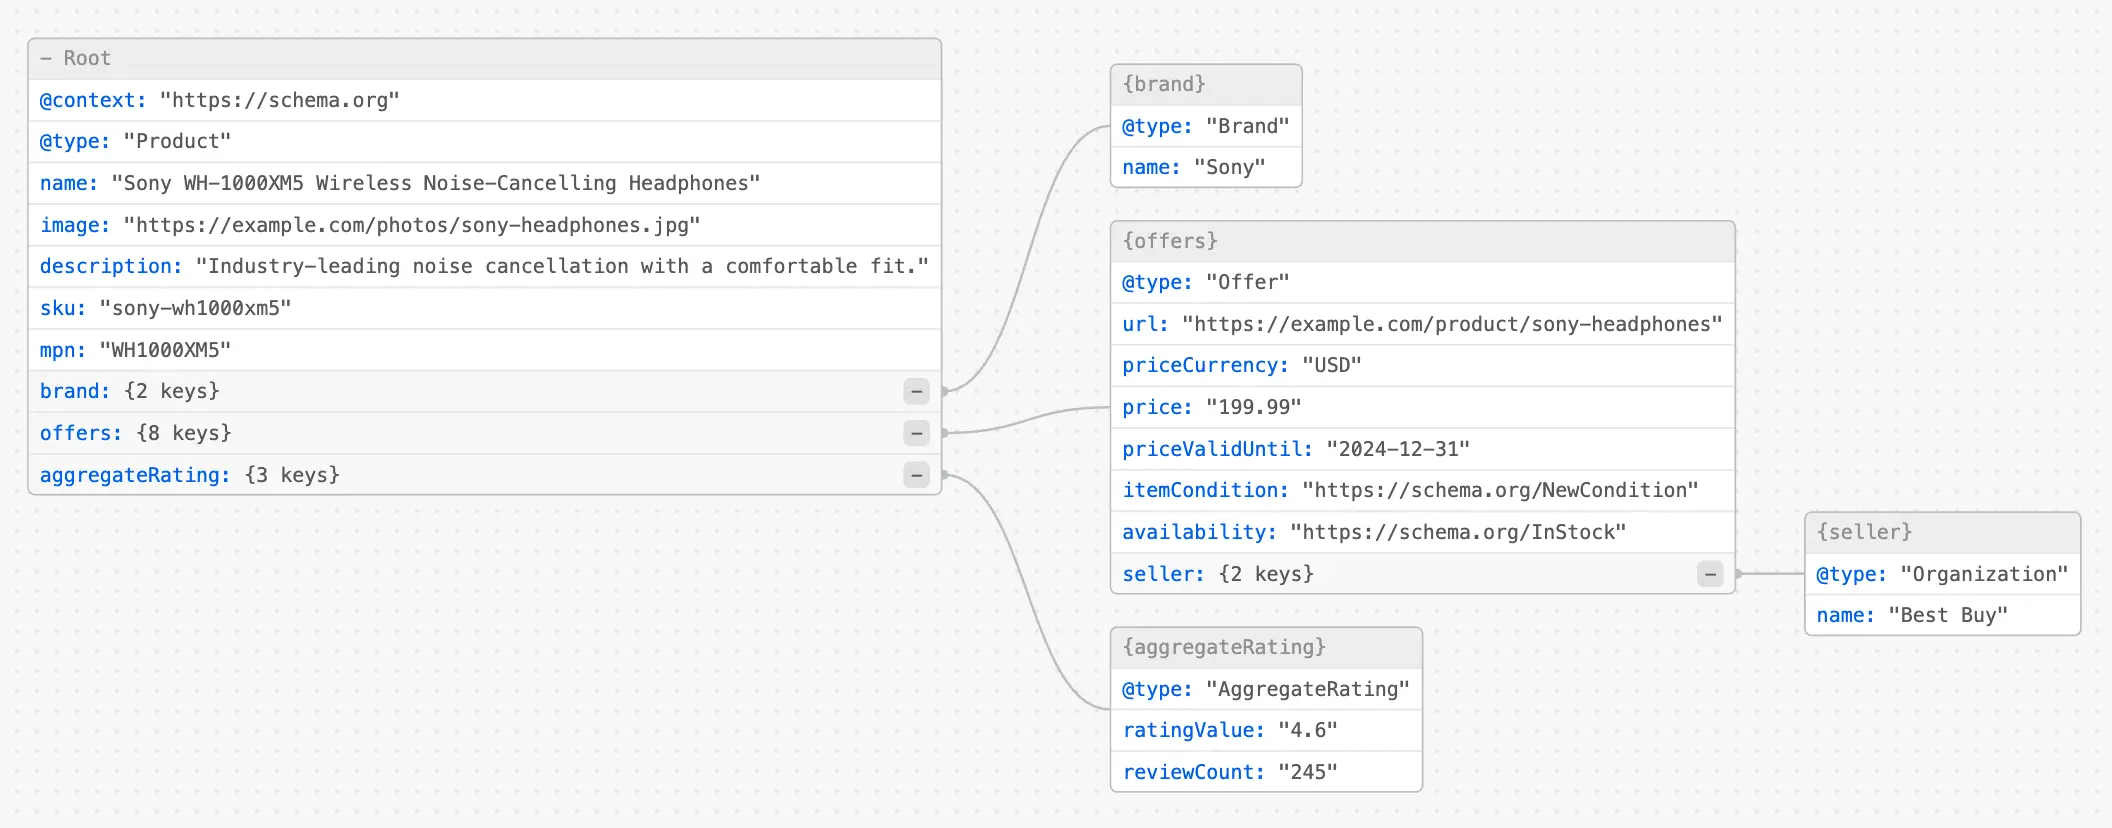
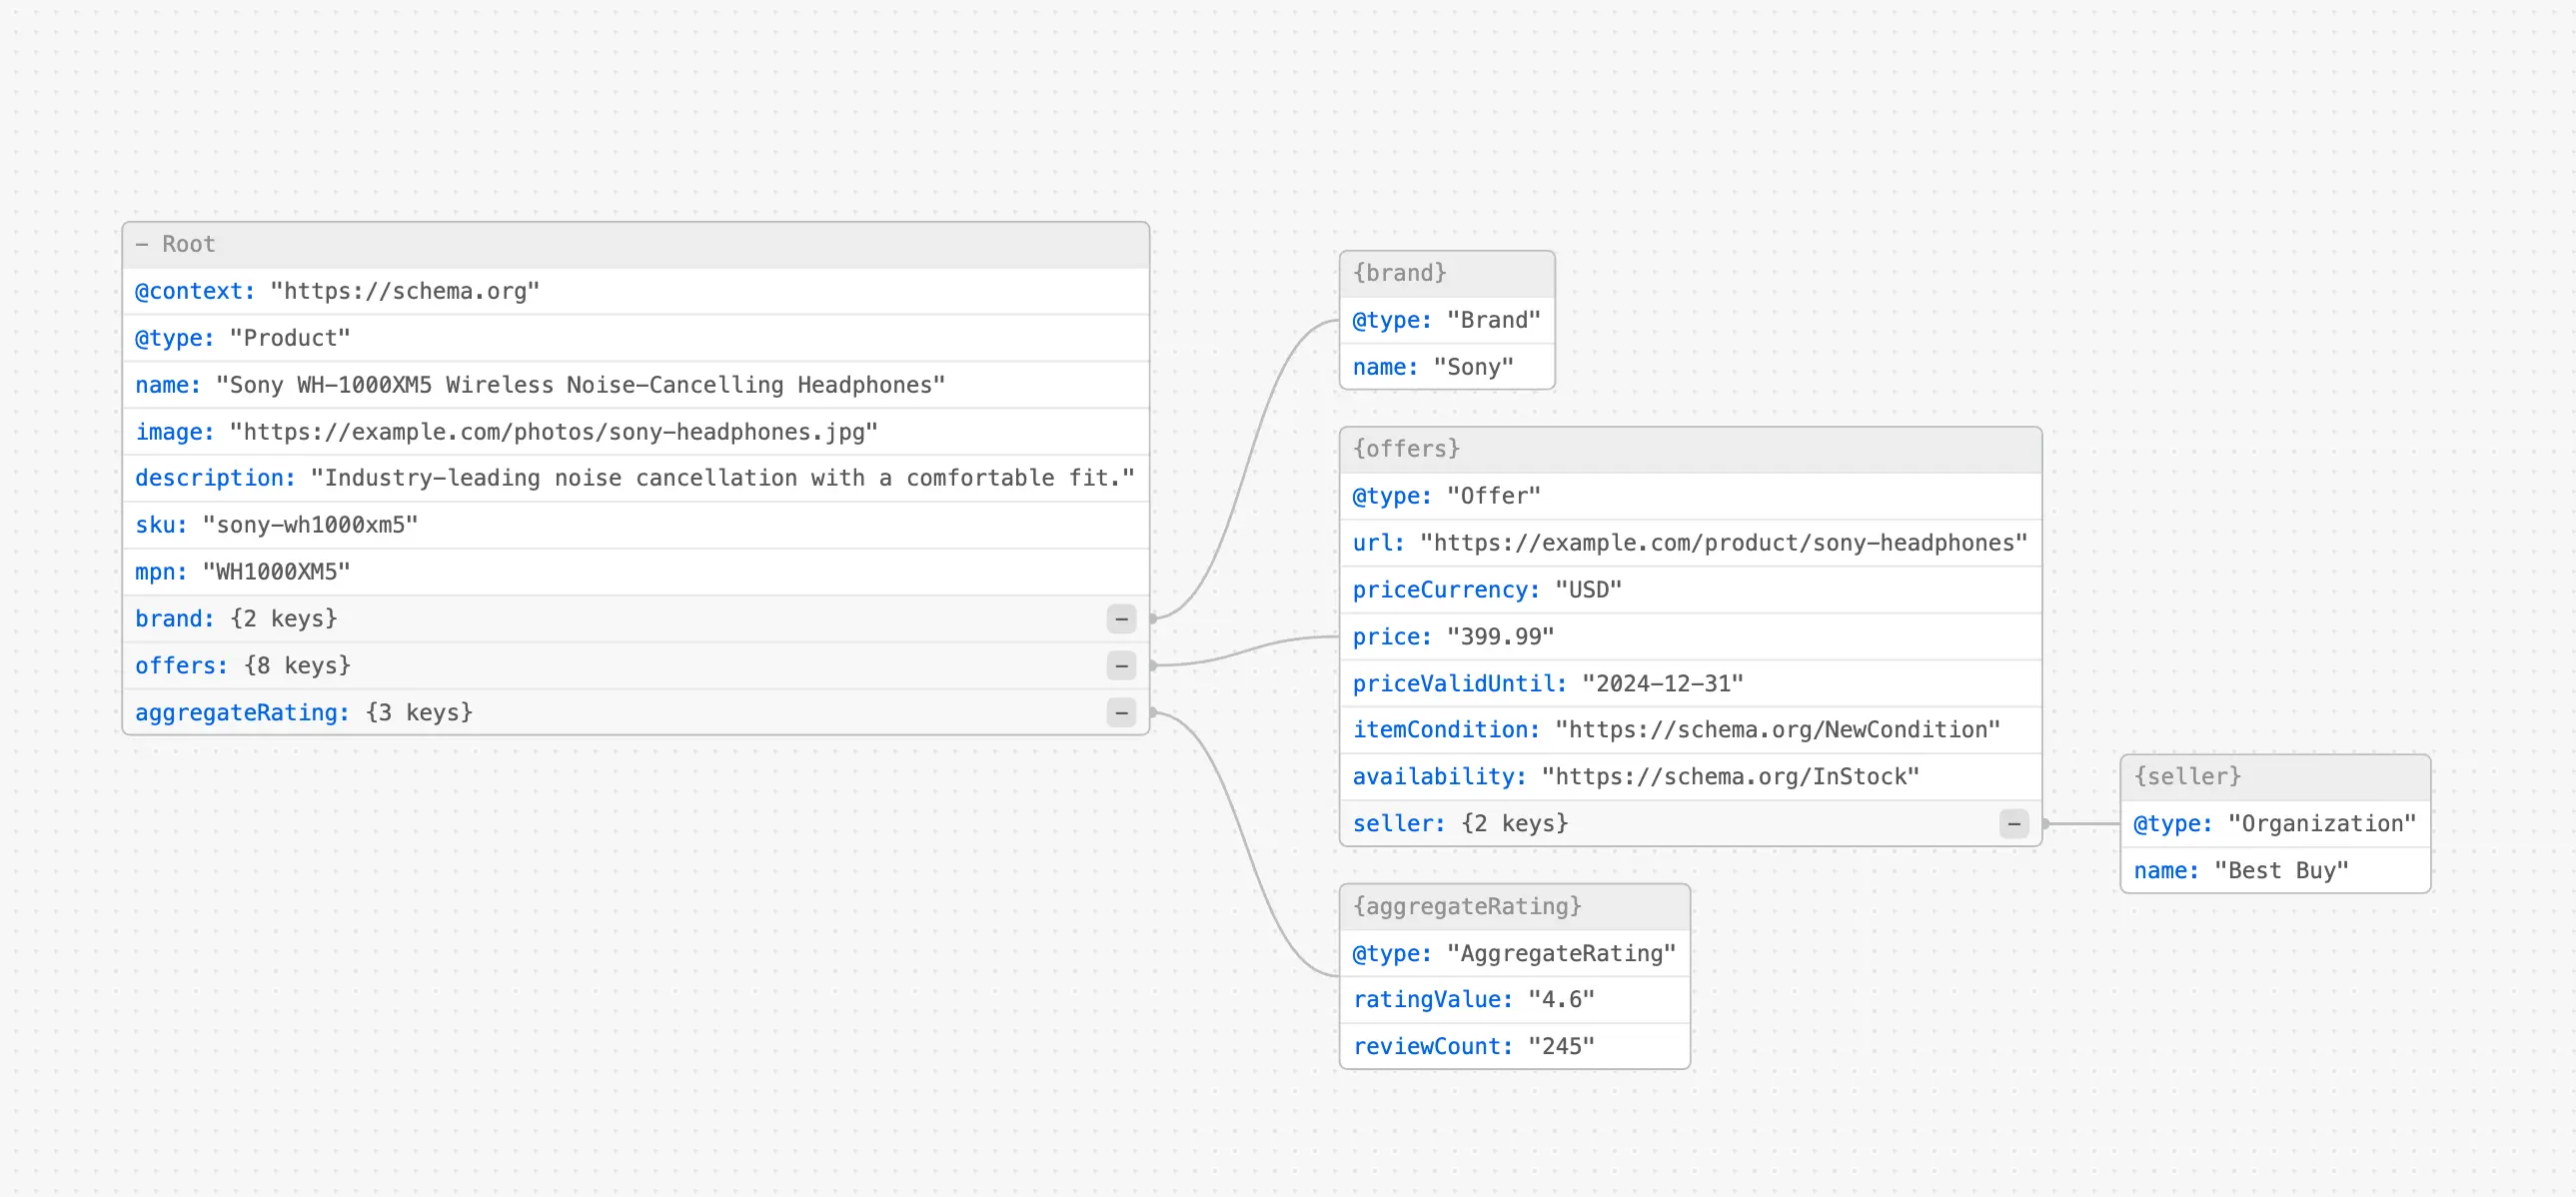
Example Use Case:
Imagine optimizing a product page for an e-commerce site. With ToDiagram, you can instantly see how the Product, Offer, and AggregateRating schemas are connected, ensuring nothing is missing or misconfigured for rich results.
3. Enhanced Editing and Flexibility
ToDiagram not only visualizes your JSON-LD data but also allows you to modify and edit it directly through the diagram interface. This is especially useful for updating multiple entities or testing schema variations without diving into raw code.
Benefits:
- Interactive Editing: Modify fields and properties directly in the visual interface and immediately see how changes affect the overall structure.
- Real-time Feedback: Make changes to the data and instantly validate it against schema.org guidelines.
4. Improving SEO Insights Through Diagrams
SEO is not just about implementing JSON-LD but understanding how it impacts your site’s visibility. By visualizing structured data, ToDiagram helps SEO analysts pinpoint gaps in their SEO strategies. For instance, spotting missing attributes or opportunities to enhance schema types can lead to improved rankings and better traffic.
Conclusion
Visualizing JSON-LD data with ToDiagram not only makes structured data more accessible but also improves the efficiency and accuracy of your SEO efforts. Whether you’re an SEO professional aiming to enhance rich snippets or a developer optimizing a website’s structure, ToDiagram bridges the gap between code and clarity. Start using it today to unlock new levels of SEO performance!