Data Visualization with ToDiagram: JSON, YAML, CSV and XML
Aykut Saraç
• September 22, 2024
In tech industry, we often work with data formats like JSON, YAML, or CSV. These formats are lightweight and pretty readable, but when the data gets complex, working with it can be a bit of a headache. That's where visualization tools like ToDiagram come in handy. Instead of staring at nested structures in raw text, you can turn them into diagrams that are much easier to grasp and work with.
Seeing Data Relationships at a Glance
Visualizing your data becomes crucial when you're dealing with large, nested, or complicated structures. A raw JSON file might be readable, but as the complexity increases, understanding relationships between objects, spotting missing fields, or ensuring consistency becomes much harder.
Turning that data into an interactive diagram instantly simplifies things.
- Complex, Nested Structures: When dealing with large or deeply nested data, visualization helps break down relationships, making it easier to grasp how objects are connected.
- API Responses: Visualizing API responses can simplify understanding and debugging. It's easier to spot what fields are missing or incorrectly structured.
- Collaborating with Non-Developers: Diagrams are excellent for sharing with non-technical team members or stakeholders. It's much easier for them to understand the data structure visually.
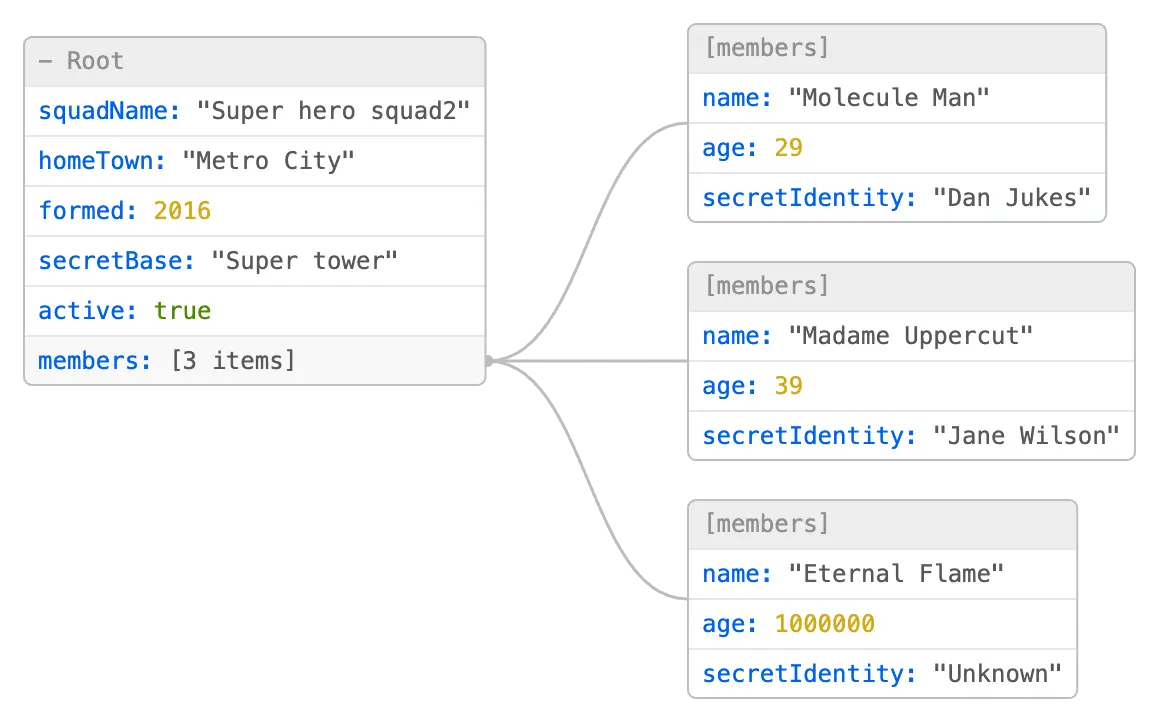
Here's a JSON example that represents a list of heroes:
{
  "squadName": "Super hero squad2",
  "homeTown": "Metro City",
  "formed": 2016,
  "secretBase": "Super tower",
  "active": true,
  "members": [
    {
      "name": "Molecule Man",
      "age": 29,
      "secretIdentity": "Dan Jukes"
    },
    {
      "name": "Madame Uppercut",
      "age": 39,
      "secretIdentity": "Jane Wilson"
    },
    {
      "name": "Eternal Flame",
      "age": 1000000,
      "secretIdentity": "Unknown"
    }
  ]
}
And here's how it looks when visualized in a diagram:
Editing Data Directly from Diagrams
One of the best features of ToDiagram is the ability to modify data directly from the diagram. Instead of diving into code to find that one deeply nested property, you can click on a node, update it, and see the changes instantly. It's not just about visualization but also control and manipulation in real-time.
Why It's Useful:
- It's faster. You don't need to hunt down that one field buried in nested objects.
- Fewer errors. You're less likely to mess up the structure or syntax when making changes.
Comparing Data
When you're working with multiple versions of the same data or comparing data from different sources, ToDiagram makes it easy to spot differences. You can load two datasets side by side and see where they differ. The tool highlights changes, additions, or deletions, making it easy to understand the discrepancies.
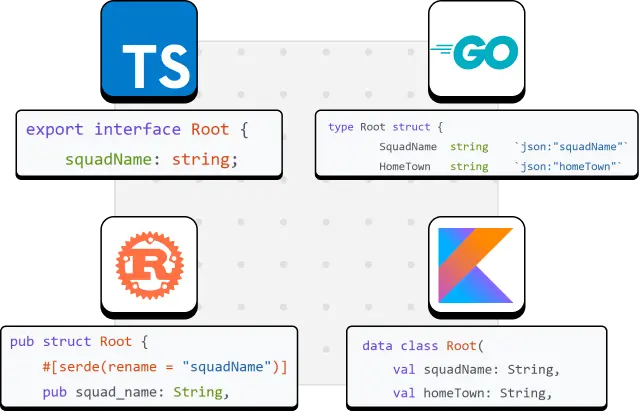
Generating Types and Schemas
ToDiagram isn't just a visual tool—it's practical for developers who need to generate types from their data. Whether you're working in TypeScript or Go, you can generate interfaces or structs automatically. Plus, the tool can generate a JSON Schema from your data, which is useful for validation or structuring APIs.
Advanced tools
ToDiagram offers a range of advanced features that make working with data even easier:
- Data Validation: Ensure your data adheres to a specific schema or structure. ToDiagram can validate your data against a JSON Schema or a custom schema you define.
- Data Generation: Need sample data for testing? ToDiagram can generate random data based on your schema. It's a quick way to create test datasets.
- REST Client: Test your APIs directly from the tool. You can make requests, see responses, and visualize the data all in one place.
- JSON Path: Extract specific data from your JSON using JSON Path expressions. It's a powerful way to filter and manipulate data.
Conclusion
ToDiagram offers a suite of features that go beyond simple data visualization. It helps developers not only understand their data but also manipulate, validate, and generate types and schemas efficiently. Whether you're working with JSON, YAML, CSV, or XML, ToDiagram streamlines these processes, making data handling faster and more intuitive.