Turn JSONYAMLXMLCSVMermaidanything
into diagrams.
Paste any structured data — or build your own with custom nodes and edges.


Paste it on the left. See it on the right.
No setup, no schema ceremony. The editor parses as you type and lays out nodes with ELK. Drag to rearrange, click to inspect, export as PNG, JPEG, or SVG.
{
  "type": "NetworkGraph",
  "version": 2,
  "metric": "etx",
  "router_id": "172.16.40.24",
  "label": "Test Network",
  "nodes": [
    { "id": 123, "label": "node A" },
    { "id": "172.16.40.60", "label": "node B" },
    { "id": "172.16.41.1", "label": "node C" }
  ]
}

Three kinds of messy data.
One clean view.
Whether you're debugging a webhook at 11pm, mapping a dataset, or dropping a diagram into a deck — ToDiagram gives the same moment of “oh, that's what it looks like.”
Stop squinting at API responses.
Paste a payload from Postman, a webhook log, or a prod incident. Get a readable graph with every field, every nested array, every null you forgot to handle.
See shape before you write a single query.
Drop in CSV headers, a sample row, or a JSON Schema. ToDiagram infers types, relationships, and cardinality so you know what you're working with.
From messy payload to shippable asset.
Export your diagram as PNG, JPEG, or SVG and drop it into tickets, slide decks, or design reviews — pixel-perfect, no manual cleanup.
Small details. Big difference.
Every feature we add answers one question: does this make the diagram easier to read? If no, we cut it.
Find any node in a 10,000-line payload.
Fuzzy search scans keys, values, and paths. Matching nodes highlight on the canvas while the rest fades — perfect for hunting down that one nested flag.
Describe it. Let AI draft the diagram.
Text-to-diagram turns plain prompts into a structured graph you can edit immediately — great for sketching a flow, a schema, or an architecture map.
Make it yours with one tap.
Swap the whole palette — nodes, rows, edges — without leaving the canvas. Hover a swatch to preview, click to commit.
One-click public links.
Publish a read-only link, share it with your team, or invite teammates to edit the same diagram alongside you.
Your data stays in your browser.
Parsing and rendering happen entirely on your machine. Diagrams are only synced to the cloud when you choose to save or share — sensitive payloads stay sensitive.
Edit your data or your diagram.
Both stay in sync.
Change a node in the diagram — the source updates. Edit a value in the structured view — the diagram redraws. It's the same truth, two ways.
Catch bad data before it ships.
Attach a JSON Schema and ToDiagram validates as you type. Failing paths light up on the diagram, and every error tells you exactly which node and which field.
Give your agent eyes for data.
One MCP server works with every coding agent you already use. Diagrams become something your AI can produce on demand — in-chat, in-IDE, in the flow.
Connect once.
Diagram anywhere.
Install @todiagram/todiagram-mcp in Claude, Cursor, Zed, VS Code or any MCP-compatible agent. Your AI can inspect a payload, read a fixture, or render a schema as a diagram — without leaving the chat.
Never leave the editor.
Ask your agent for a diagram mid-debug. It opens in a pane next to your code.
Knows your repo.
The server reads files the agent already has access to — diagram any fixture, schema, or config on demand.
Link & embed output.
Every generated diagram comes back as a live URL — drop it in a PR, doc, or Slack.
One tool. Many shapes of data.
CI/CD diagrams
Map pipelines, jobs, and dependencies from a single config file.
for platform teamsNetwork diagrams
Visualize routers, hosts, and links from structured topology data.
for infraAPI design & docs
Turn OpenAPI or raw responses into a navigable type graph.
for API teamsJSON Schema
See every required, every type, every $ref — all in one view.
for backend devsDesign systems & tokens
Explore design tokens and theme objects as a structured map.
for designersJSON-LD
Render linked data documents so context and types are easy to read.
for data teamsMermaid diagrams
Paste flowcharts, sequence, and state — render them cleanly.
for everyoneCustom nodes & edges
Define your own nodes and edges for anything data-shaped.
power users“Finally, my JSON makes sense.”
A few words from teams who paste weird data for a living.
At DynamicSource, we work with complex JSON files to define calculation algorithms for our performance applications. ToDiagram has been extremely helpful for visualizing complex logic and navigating deeply nested structures. Of all the tools we tried, ToDiagram is by far the most intuitive and powerful, making it much easier to work with our data.
Paste in a payload, see the shape, share the link. It's the workflow I always wished browsers had built in.
Our team uses ToDiagram to document the shape of every new API. The diagrams update with the data — onboarding engineers has gotten noticeably faster.
Some data
wants to be seen.
Paste a payload in seconds. Free to try, with Pro plans for teams that share a lot.
Guides, tips & news
from ToDiagram.
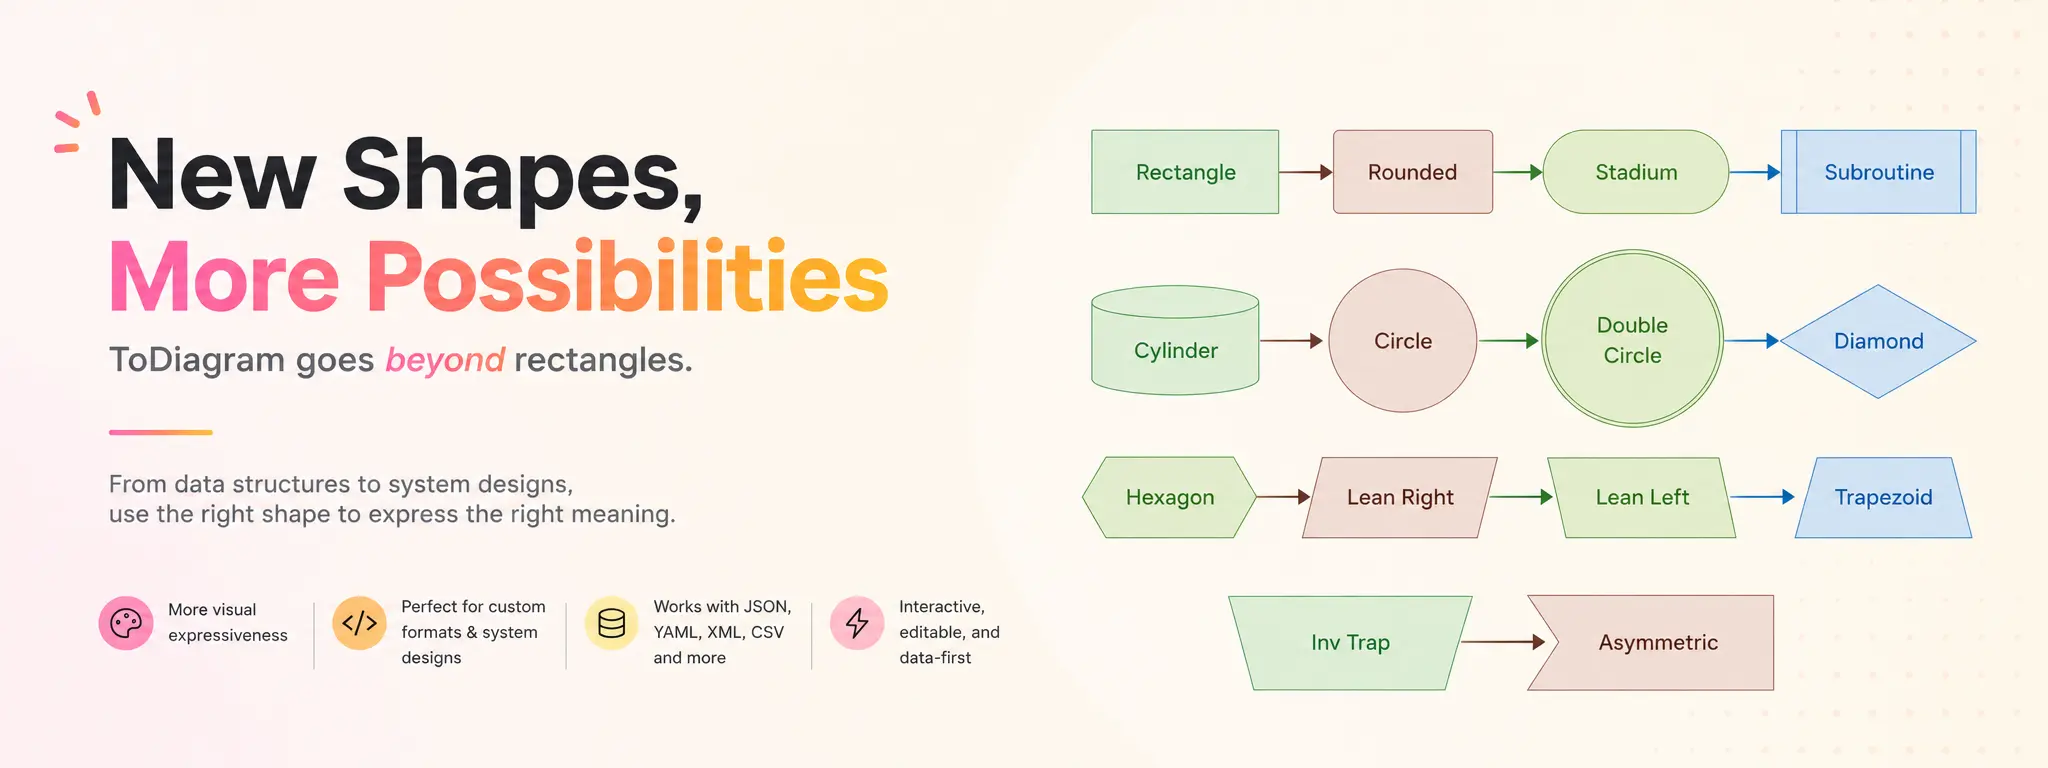
Introducing New Shapes in ToDiagram
ToDiagram now supports more node shapes for Mermaid and custom diagrams, including diamonds, cylinders, circles, hexagons, parallelograms, trapezoids, and more.
Visualize Pull Requests as Diagrams
Large pull requests hide structural changes across scattered diffs. Instead of mentally reconstructing the system, let an LLM explain the PR as a diagram and review the shape of the change before reading the code.
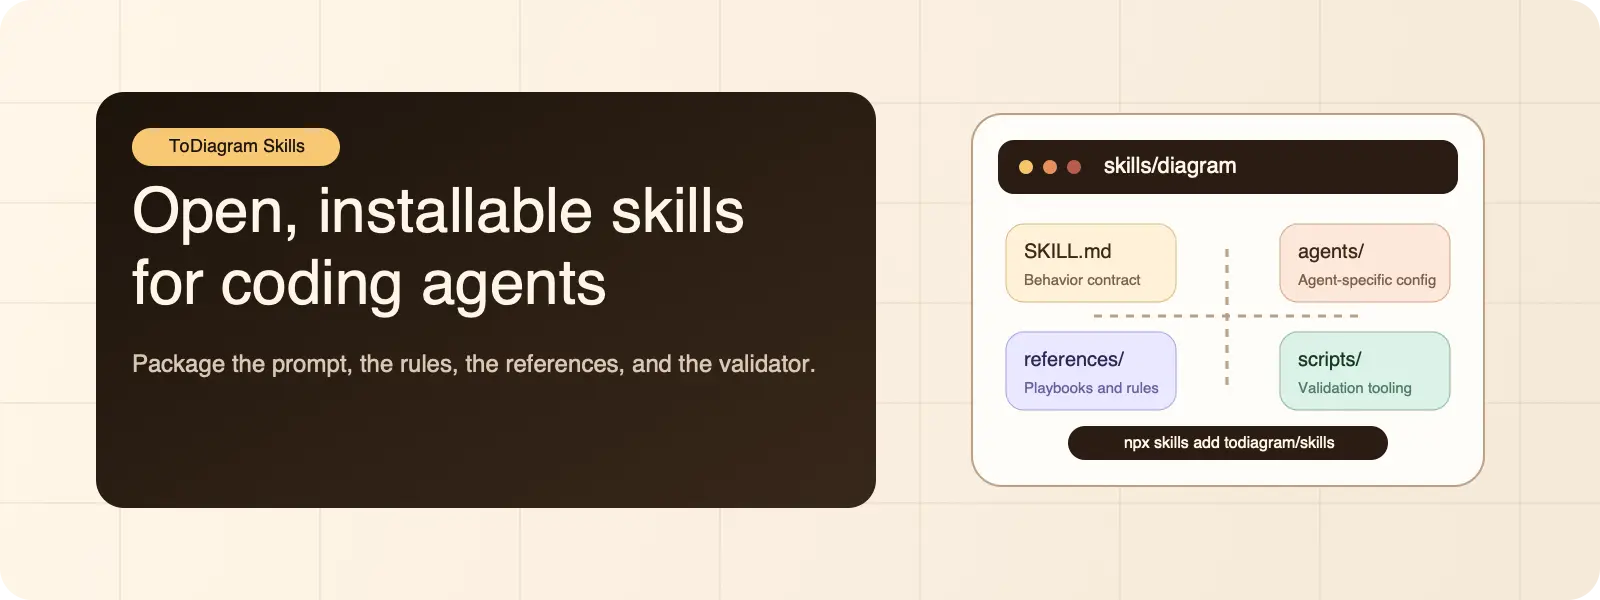
Introducing ToDiagram Skills for Coding Agents
ToDiagram Skills is a public repository of installable agent skills. The first published `diagram` skill helps coding agents create clearer diagrams for architecture, flows, and AI-generated diffs.
Frequently asked questions
Answers about pricing, formats, data handling, and the editor.