Visualizing and Editing XML Data
Transform and manage XML files with interactive diagrams, validate and format data with ease.
Trusted by 2500+ happy users worldwide
Used by professionals working at
Advanced XML Viewer and Editor with Diagram Visualization
ToDiagram is a powerful XML editor that transforms complex XML data into interactive diagrams and trees. This visual representation makes it easier to explore, understand, and edit your XML data, enhancing clarity and efficiency in data management.
Sign up free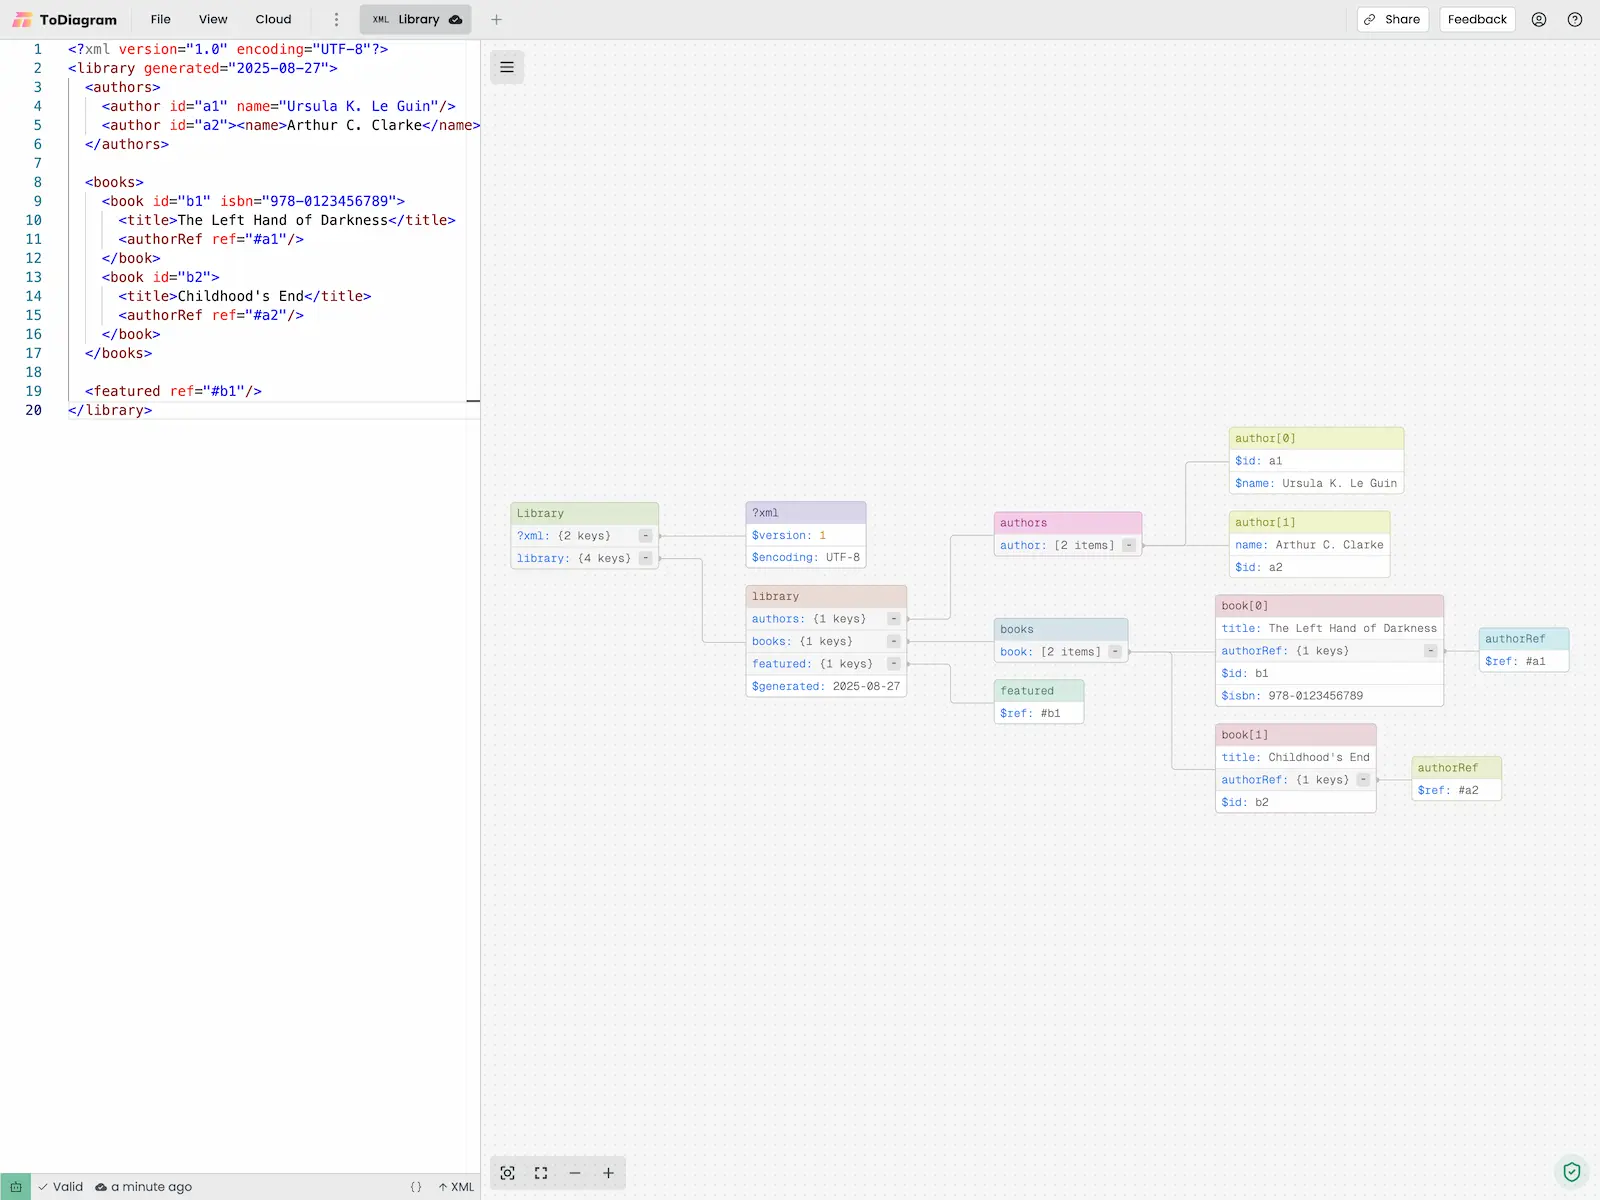
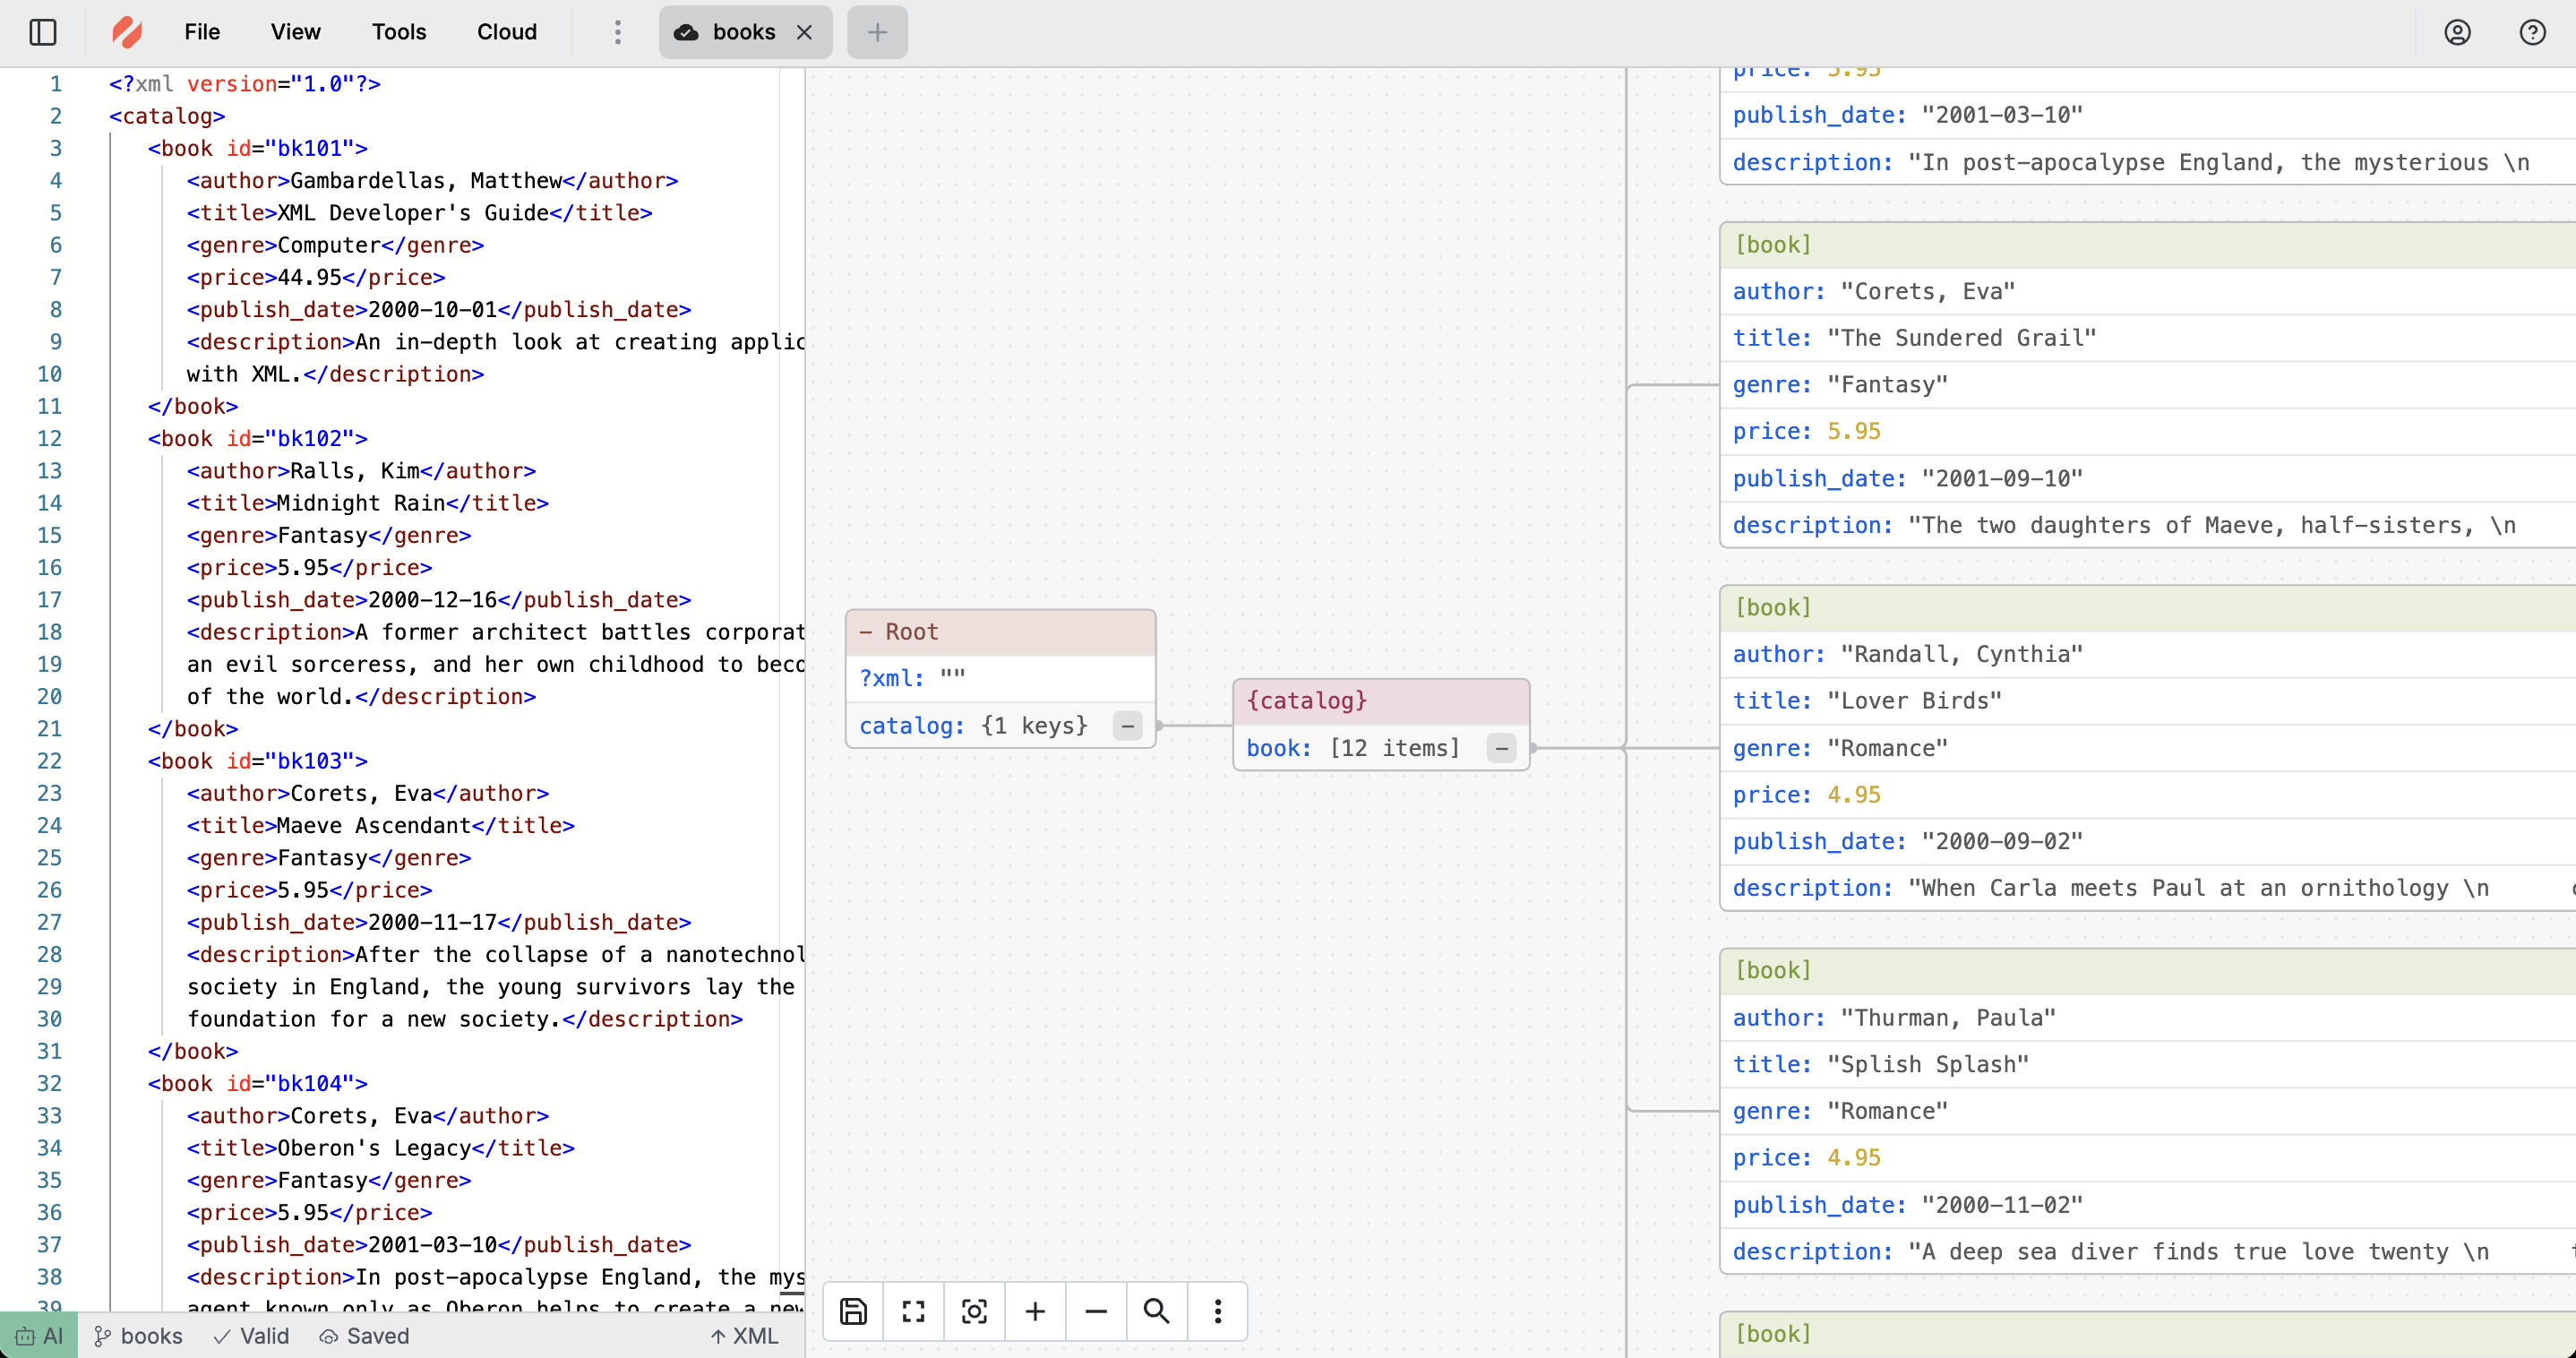
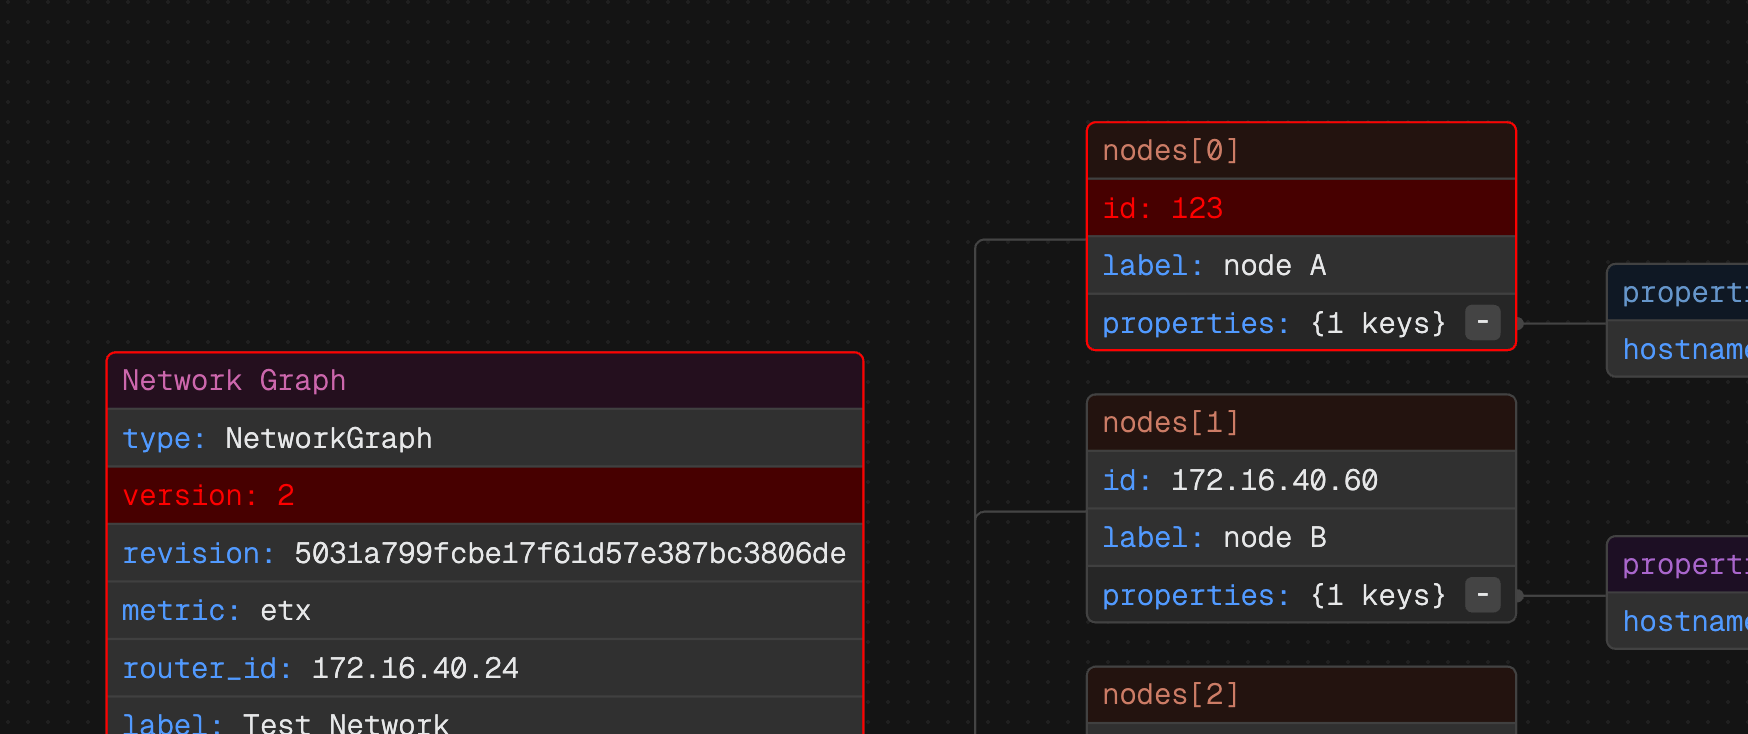
Visualize XML as diagrams
Turn elements and attributes into an interactive XML diagram and tree to understand structure faster. Explore nesting and relationships without scanning long tag blocks.
Edit XML with a live viewer
Use a fast XML editor and viewer to update values and attributes in context. The diagram keeps hierarchy clear while you work.
Navigate elements and attributes
Navigate nested elements quickly and view attributes in context so structure stays clear as files grow. Jump across related nodes without losing your place.
Export and share
Export PNG/SVG for documentation and tickets or share a link so others can review the same XML structure. Ideal for sitemap and config reviews.
Why ToDiagram is the best tool to visualize XML files?
Cloud Storage
Store your data in the cloud, access it from anywhere, and share it with your team.

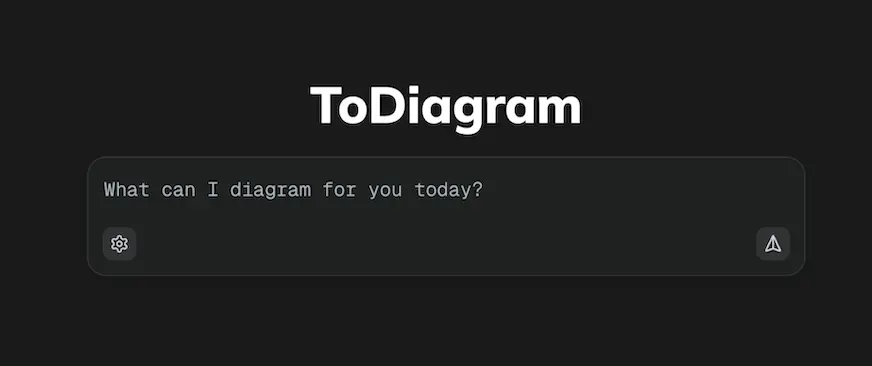
Text to Diagram AI
Convert your text descriptions into diagrams automatically, saving you time and effort in visualizing your data.
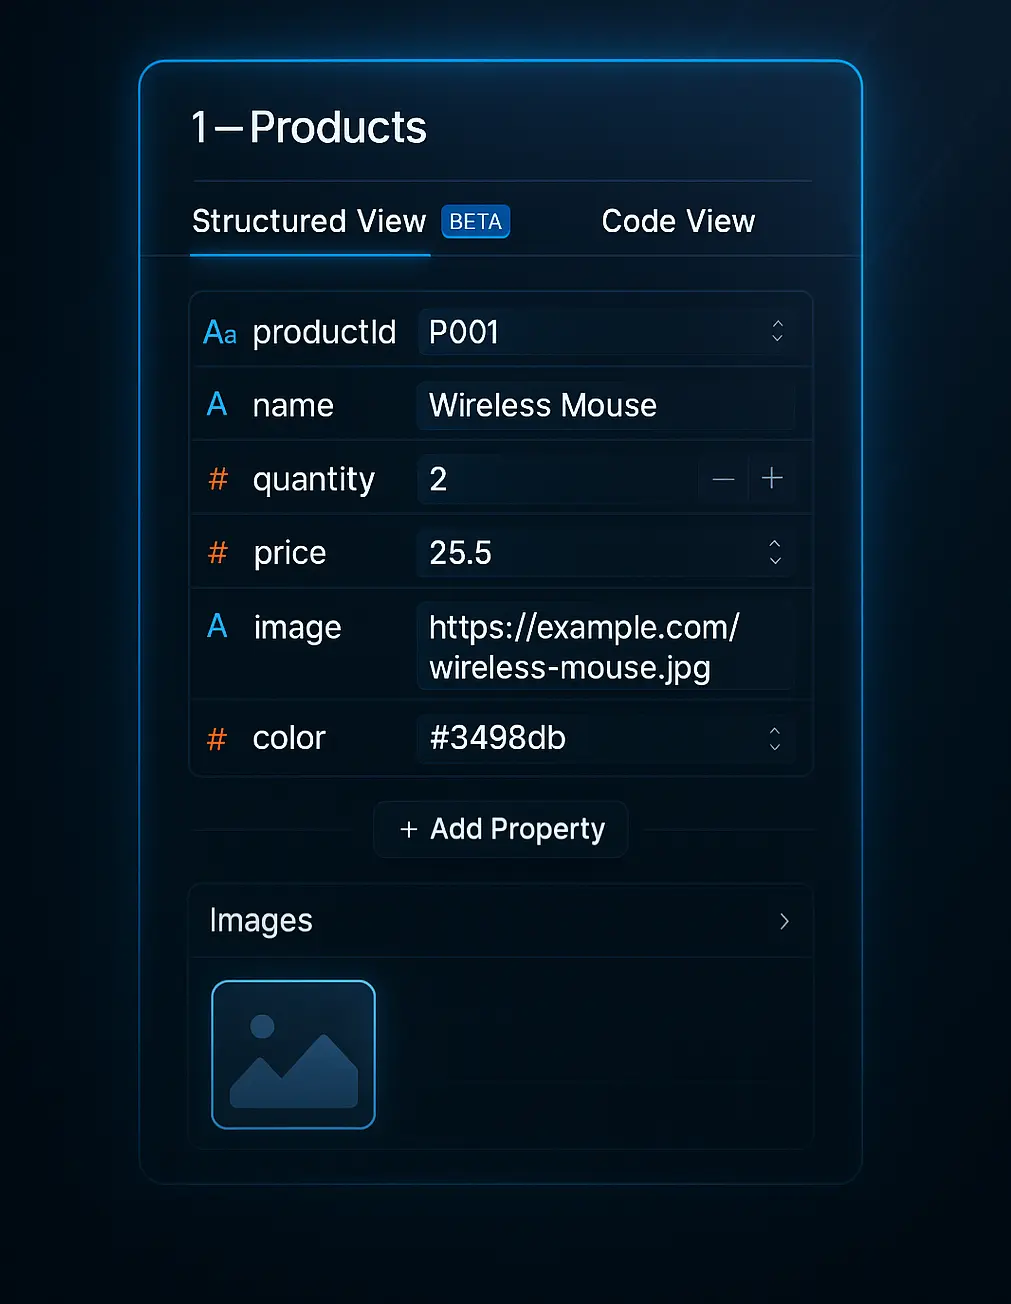
Powerful Visual Editing
Edit your data visually with our intuitive interface, making it easy to manage and manipulate your datasets.
Validate JSON Schema
Ensure your data adheres to the defined schema, preventing errors and ensuring data integrity. Easily identify and fix issues with our validation tools.
Frequently Asked Questions
Find questions and answers about our platform, services, and more.
More questions? Send us a message.