How to Build Custom Diagrams in ToDiagram
Aykut Saraç
• July 11, 2025
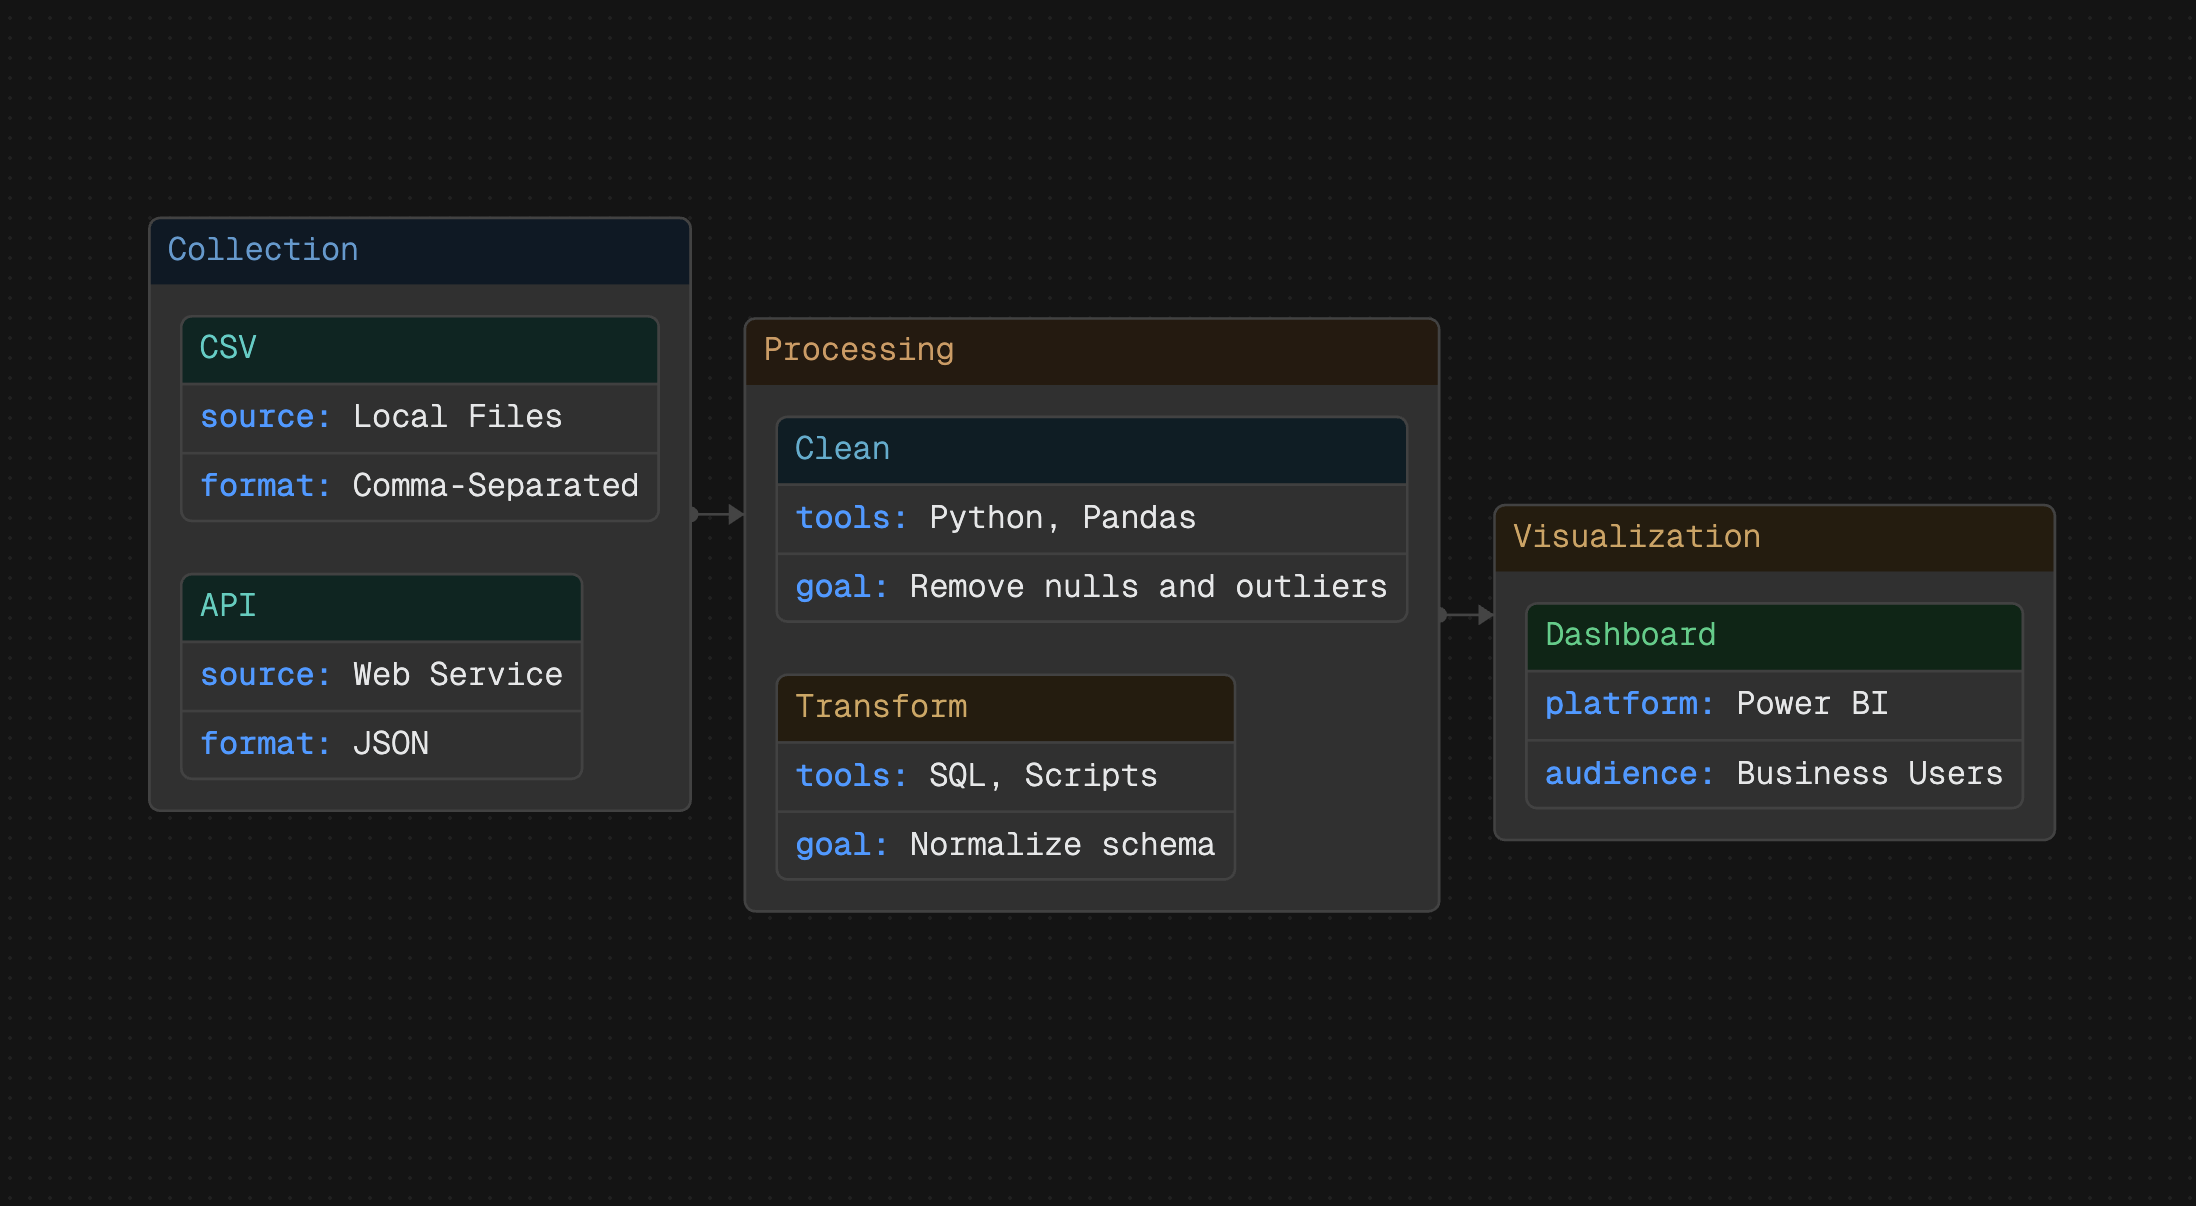
ToDiagram makes it simple to visualize JSON, YAML, or CSV—but what if your data uses a unique structure, or you need nested relationships? With the Custom format, you can define:
- Any key names for nodes and edges (IDs, labels, source/target fields)
- Arbitrary nesting, so diagrams reflect parent-child hierarchies in your data
- Multi-level structures, from organization charts to complex workflows
In this post, we'll cover how to:
- Select Custom format in the editor
- Map your field names to diagram properties
- Prepare JSON data with nested nodes
- Visualize your custom diagram instantly
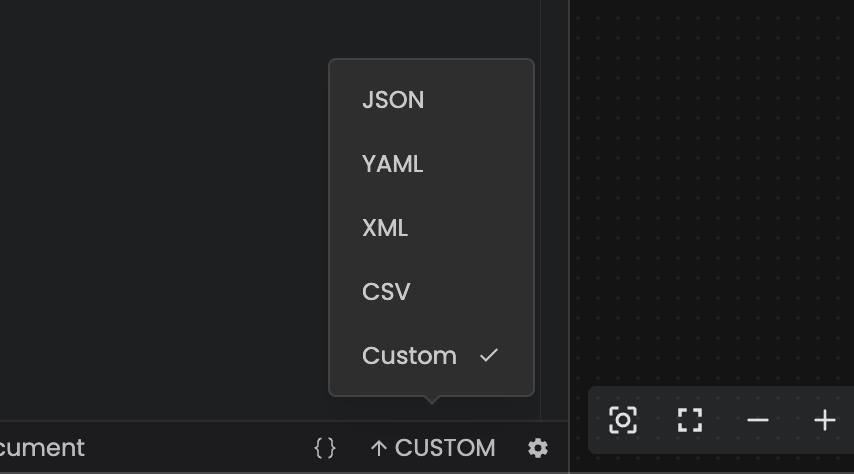
1. Set Format to Custom
- Open the bottom-left Format dropdown
- Choose Custom
This tells ToDiagram to switch into Custom mode and unlock field mapping.
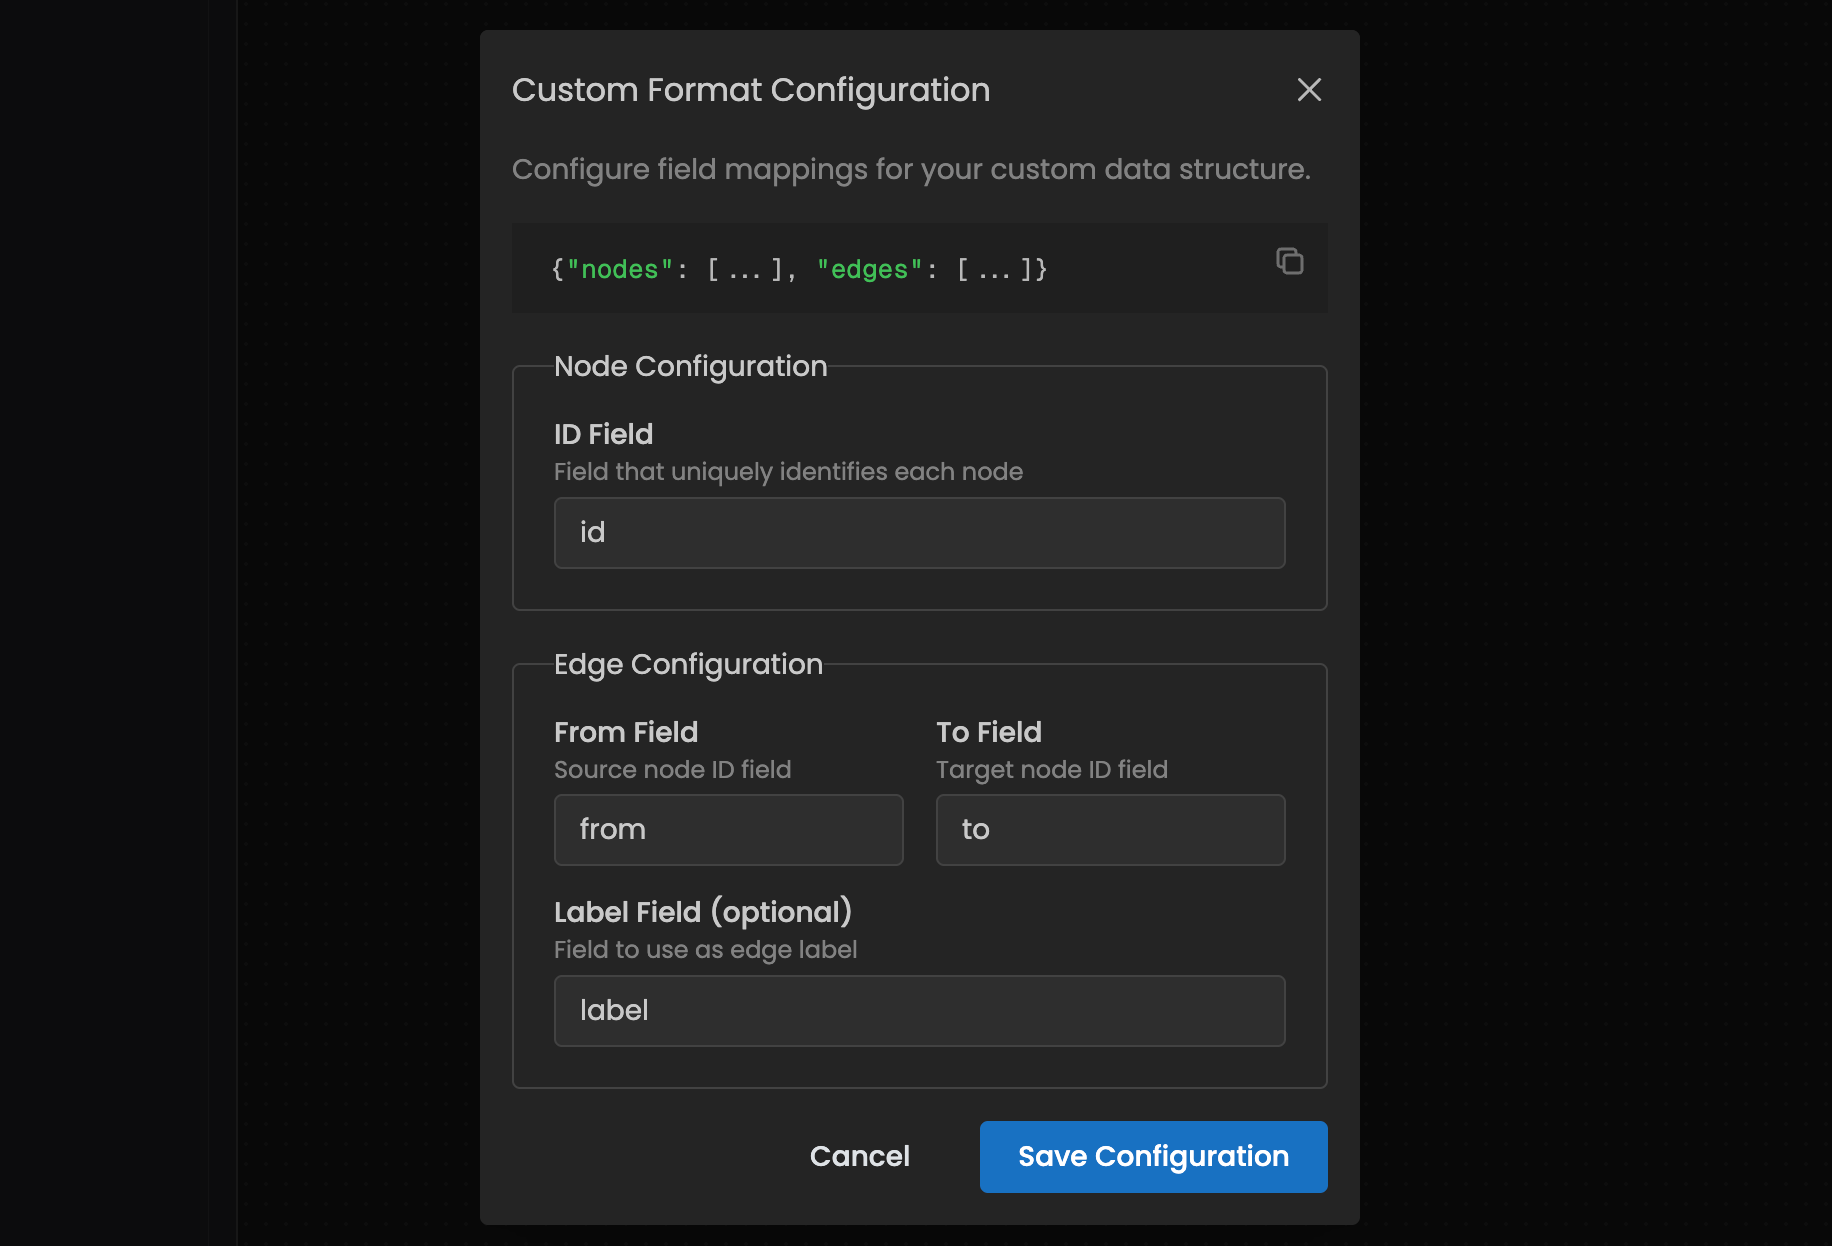
2. Configure Your Field Mappings
After selecting Custom, you'll see a panel for mapping your data:
- Nodes array key: where your nodes live (e.g.,
nodes,entities) - Node ID field: which property uniquely identifies each node (e.g.,
id,uid) - Edges array key: where your links are (e.g.,
edges,links) - Edge source/target fields: your field names for connections (e.g.,
from/to,src/dst) - Edge label field (optional): if you want to display text on edges
Tip: Mix and match names to match your data—ToDiagram adapts automatically.
3. Prepare Your JSON Data
Your JSON only needs to follow the keys you just configured. Here are two examples:
Simple example
{
  "nodes": [
    { "id": "a", "label": "Start" },
    { "id": "b", "label": "Process" },
    { "id": "c", "label": "End" }
  ],
  "edges": [
    { "from": "a", "to": "b" },
    { "from": "b", "to": "c" }
  ]
}
Nested nodes example
{
  "entities": [
    {
      "uid": "root",
      "field": "Root",
      "entities": [
        {
          "uid": "child1",
          "anotherField": "Child 1"
        },
        {
          "uid": "child2",
          "anotherField2": "Child 2"
        }
      ]
    }
  ],
  "links": [
    {
      "source": "child1",
      "target": "child2",
      "text": "links to"
    }
  ]
}
4. Visualize Your Diagram
- Paste your JSON or upload a file.
- Your custom diagram will render instantly, with nested layouts and labels.
Note: Custom diagrams are read-only in the viewer. To change the structure, modify your JSON.
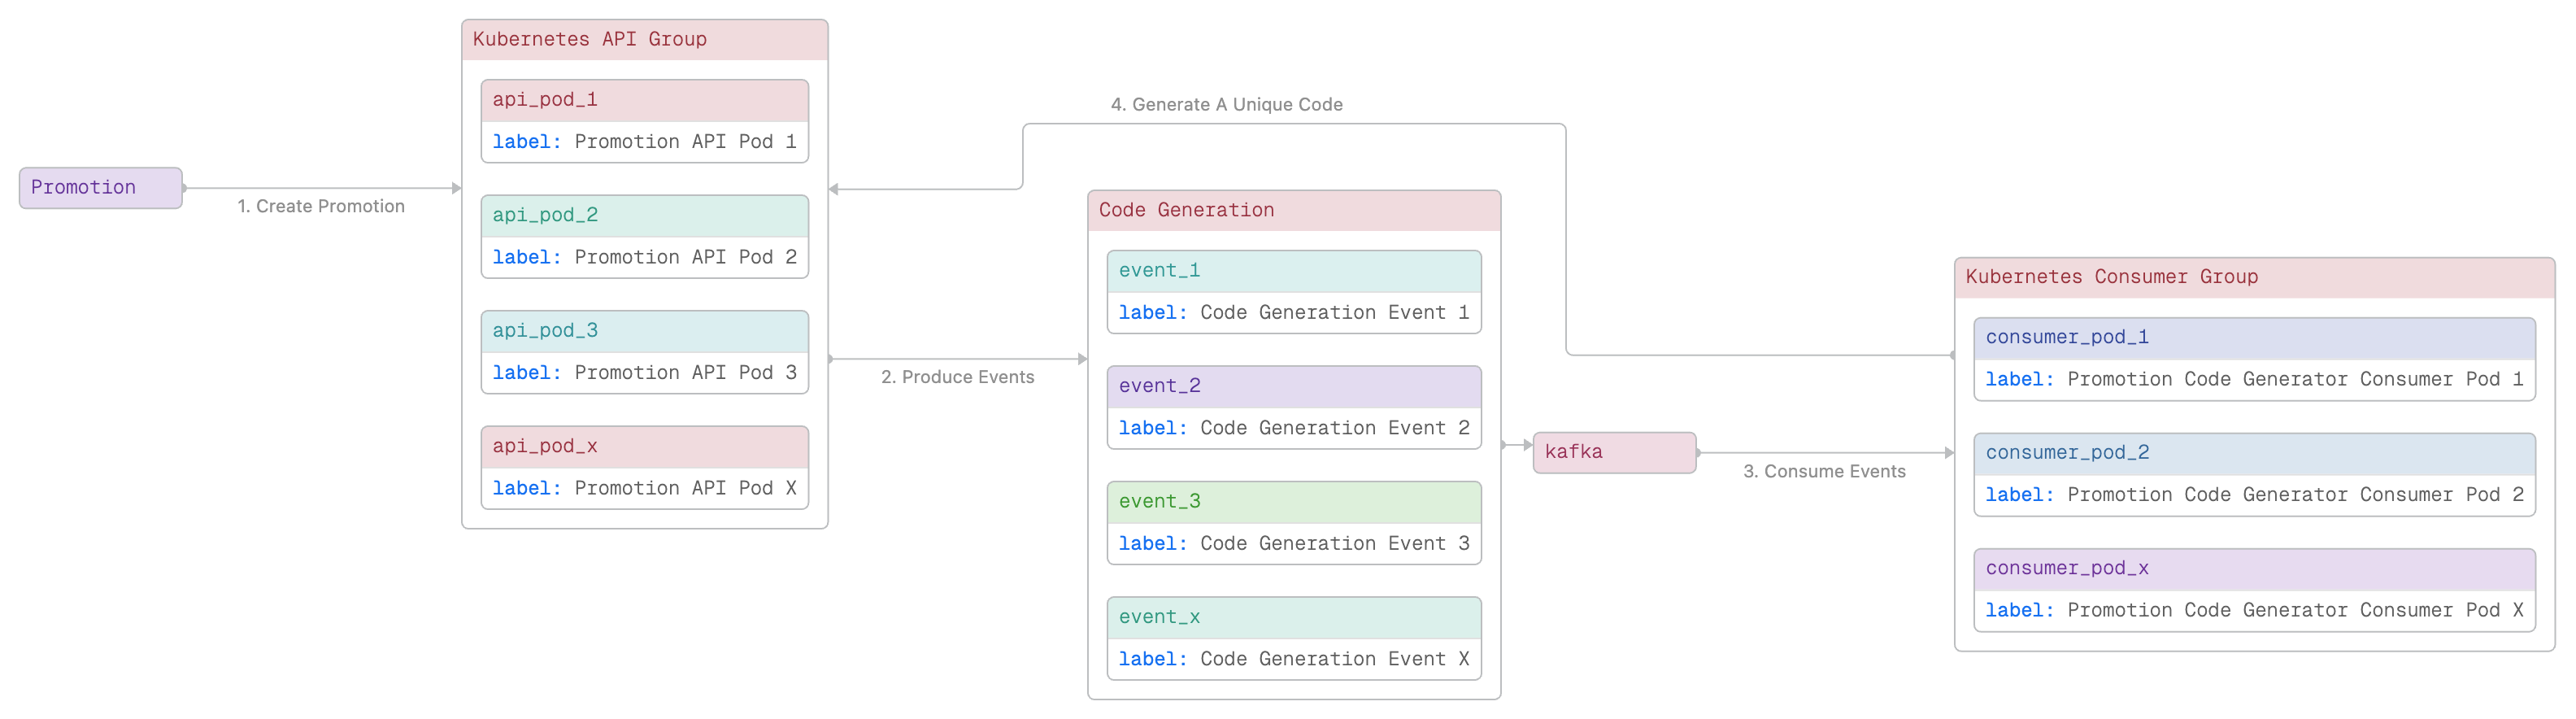
Real-World Use Cases
- Organization charts with departments and sub-teams
- Mind maps that expand recursively
- Business processes linking stages and sub-tasks
- API models or domain-specific graphs
Final Thoughts
Custom diagrams unlock ToDiagram’s flexibility. By defining your own:
- Keys for nodes and edges
- Nested hierarchies
- Optional labels
you can tailor visualizations exactly to your data and workflow—no code required. Give it a try and see how fast you can bring your unique models to life!