JSON-LD Schema Visualization
Visualize and edit JSON-LD schemas effortlessly with ToDiagram. Create interactive diagrams that simplify complex data structures, enhancing collaboration and productivity for developers, analysts, and teams.
Trusted by 2500+ happy users worldwide
Used by professionals working at
How to Visualize JSON-LD Schemas?
ToDiagram simplifies the process of visualizing and editing JSON-LD schemas by transforming them into interactive diagrams. With ToDiagram, you can easily create visual representations of JSON-LD data, making it easier to understand the relationships between different parts of your schema. This visual clarity allows you to quickly identify patterns, errors, and inconsistencies, streamlining your data analysis process.
Why Use ToDiagram for JSON-LD Schema Visualization?
ToDiagram enhances collaboration and productivity by providing a visual representation of your JSON-LD schemas. By creating interactive diagrams, you can easily communicate your data models, relationships, and patterns to your team, stakeholders, and clients. This visual clarity ensures that everyone is aligned on the data structure, reducing the risk of miscommunication and errors. With ToDiagram, you can easily edit, validate, and organize your JSON-LD schemas, streamlining your workflow and boosting productivity.
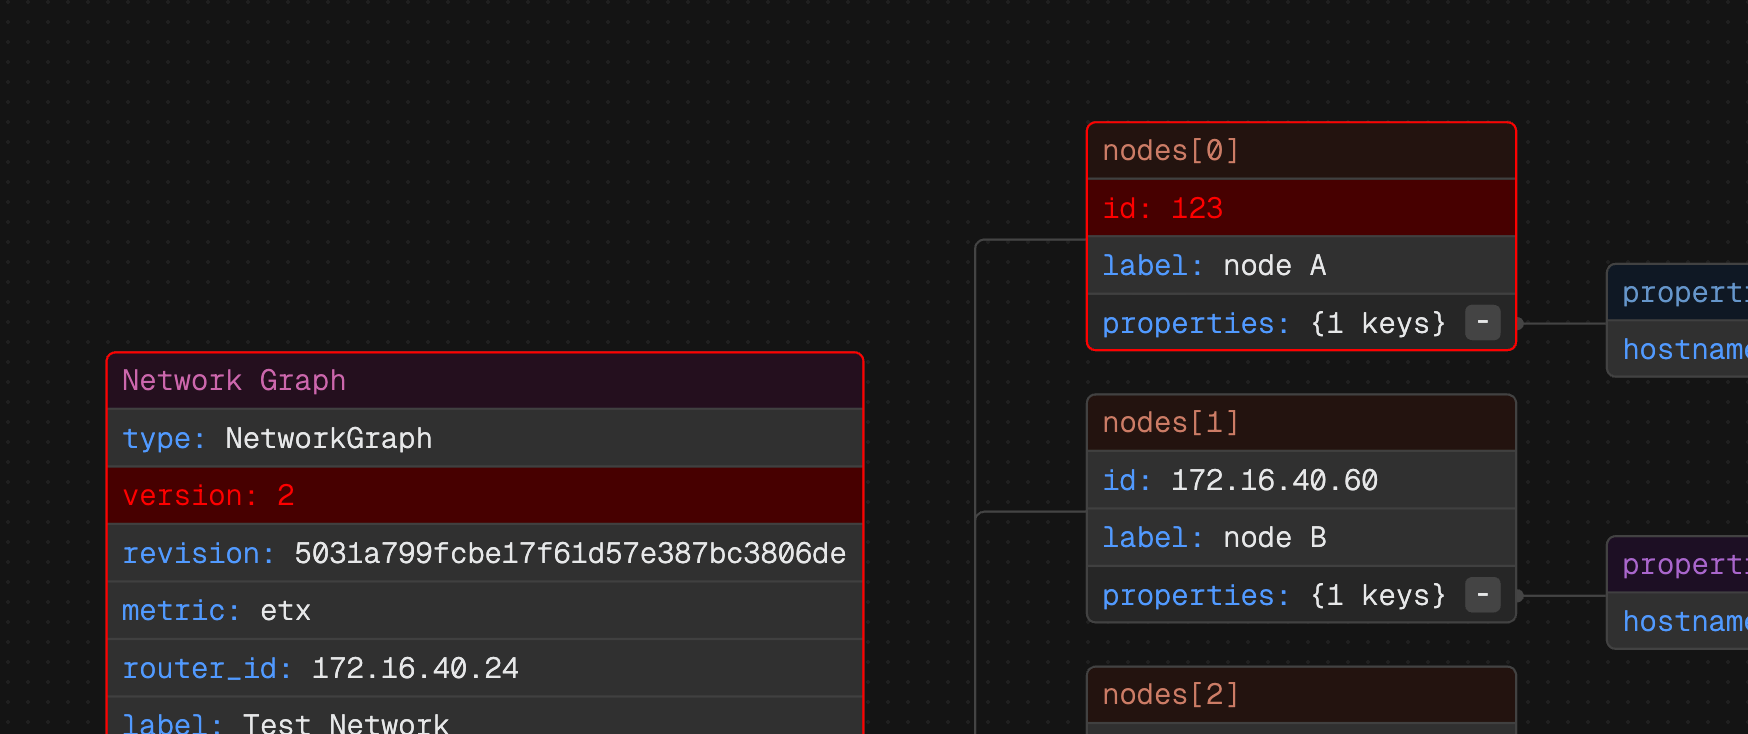
Validate and troubleshoot
Spot missing @context entries, type mismatches and disconnected nodes faster with a structure-aware view.
Export and share
Export high-quality images for docs and proposals or share links to collaborate in reviews.
Why ToDiagram is the best tool to visualize JSON-LD?
Cloud Storage
Store your data in the cloud, access it from anywhere, and share it with your team.

Text to Diagram AI
Convert your text descriptions into diagrams automatically, saving you time and effort in visualizing your data.
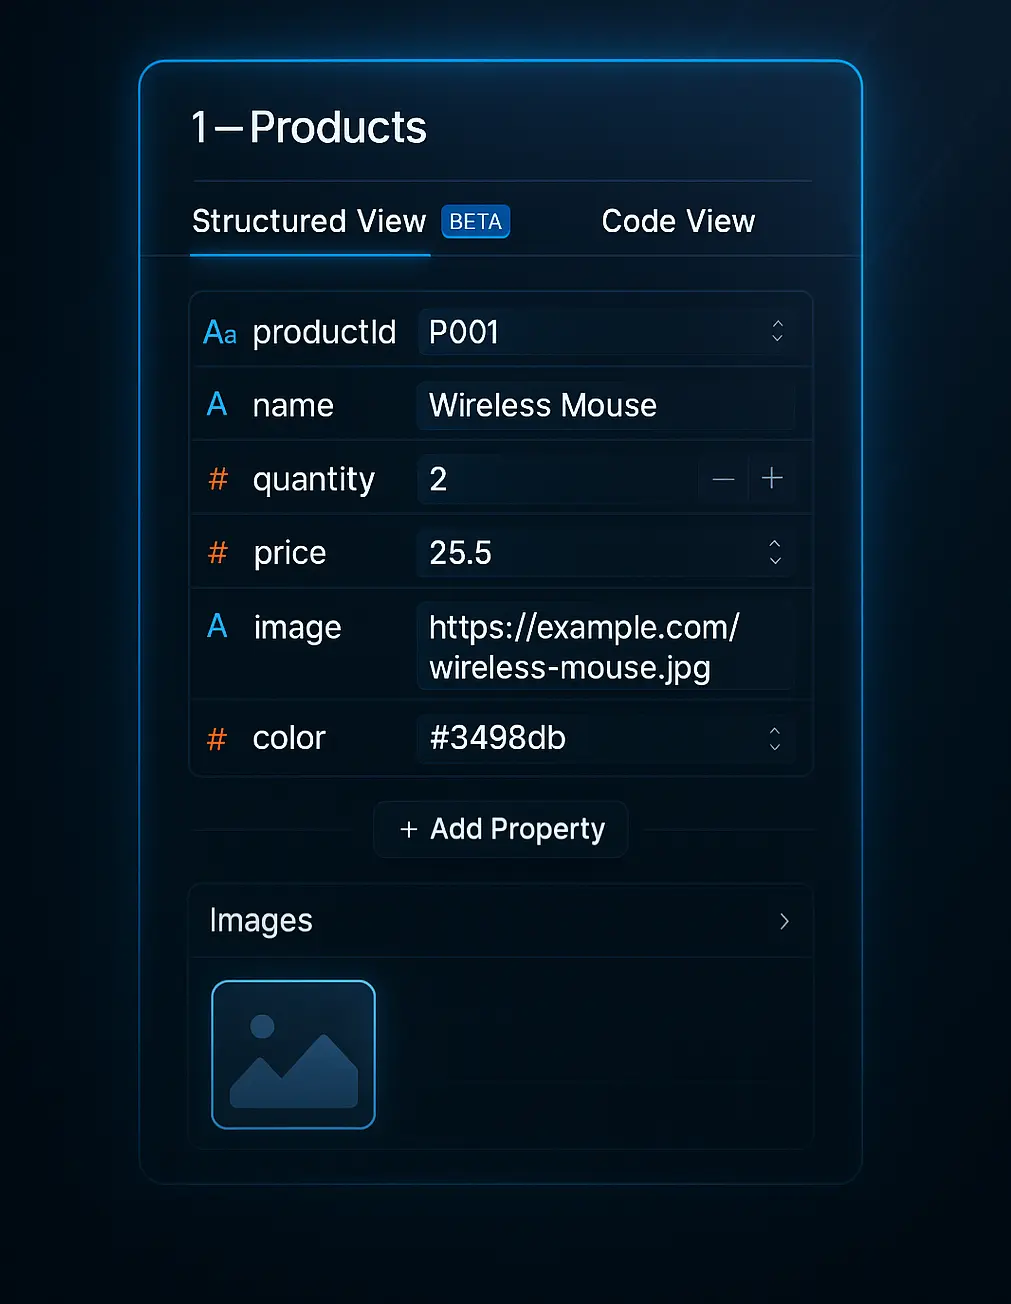
Powerful Visual Editing
Edit your data visually with our intuitive interface, making it easy to manage and manipulate your datasets.
Validate JSON Schema
Ensure your data adheres to the defined schema, preventing errors and ensuring data integrity. Easily identify and fix issues with our validation tools.
Explore More Use Cases
Discover how ToDiagram can help you in various scenarios, from software development to project management.
Frequently Asked Questions
Find questions and answers about our platform, services, and more.
More questions? Send us a message.