Visualizing and Editing CSV Data
ToDiagram simplifies the process of editing and visualizing CSV files with interactive diagrams and tree views. Learn how to manage CSV with ease.
Trusted by 2500+ happy users worldwide
Used by professionals working at
Advanced CSV Viewer and Editor with Diagram Visualization
ToDiagram is a powerful CSV editor that transforms complex CSV data into interactive diagrams and trees. This visual representation makes it easier to explore, understand, and edit your CSV data, enhancing clarity and efficiency in data management.
Sign up free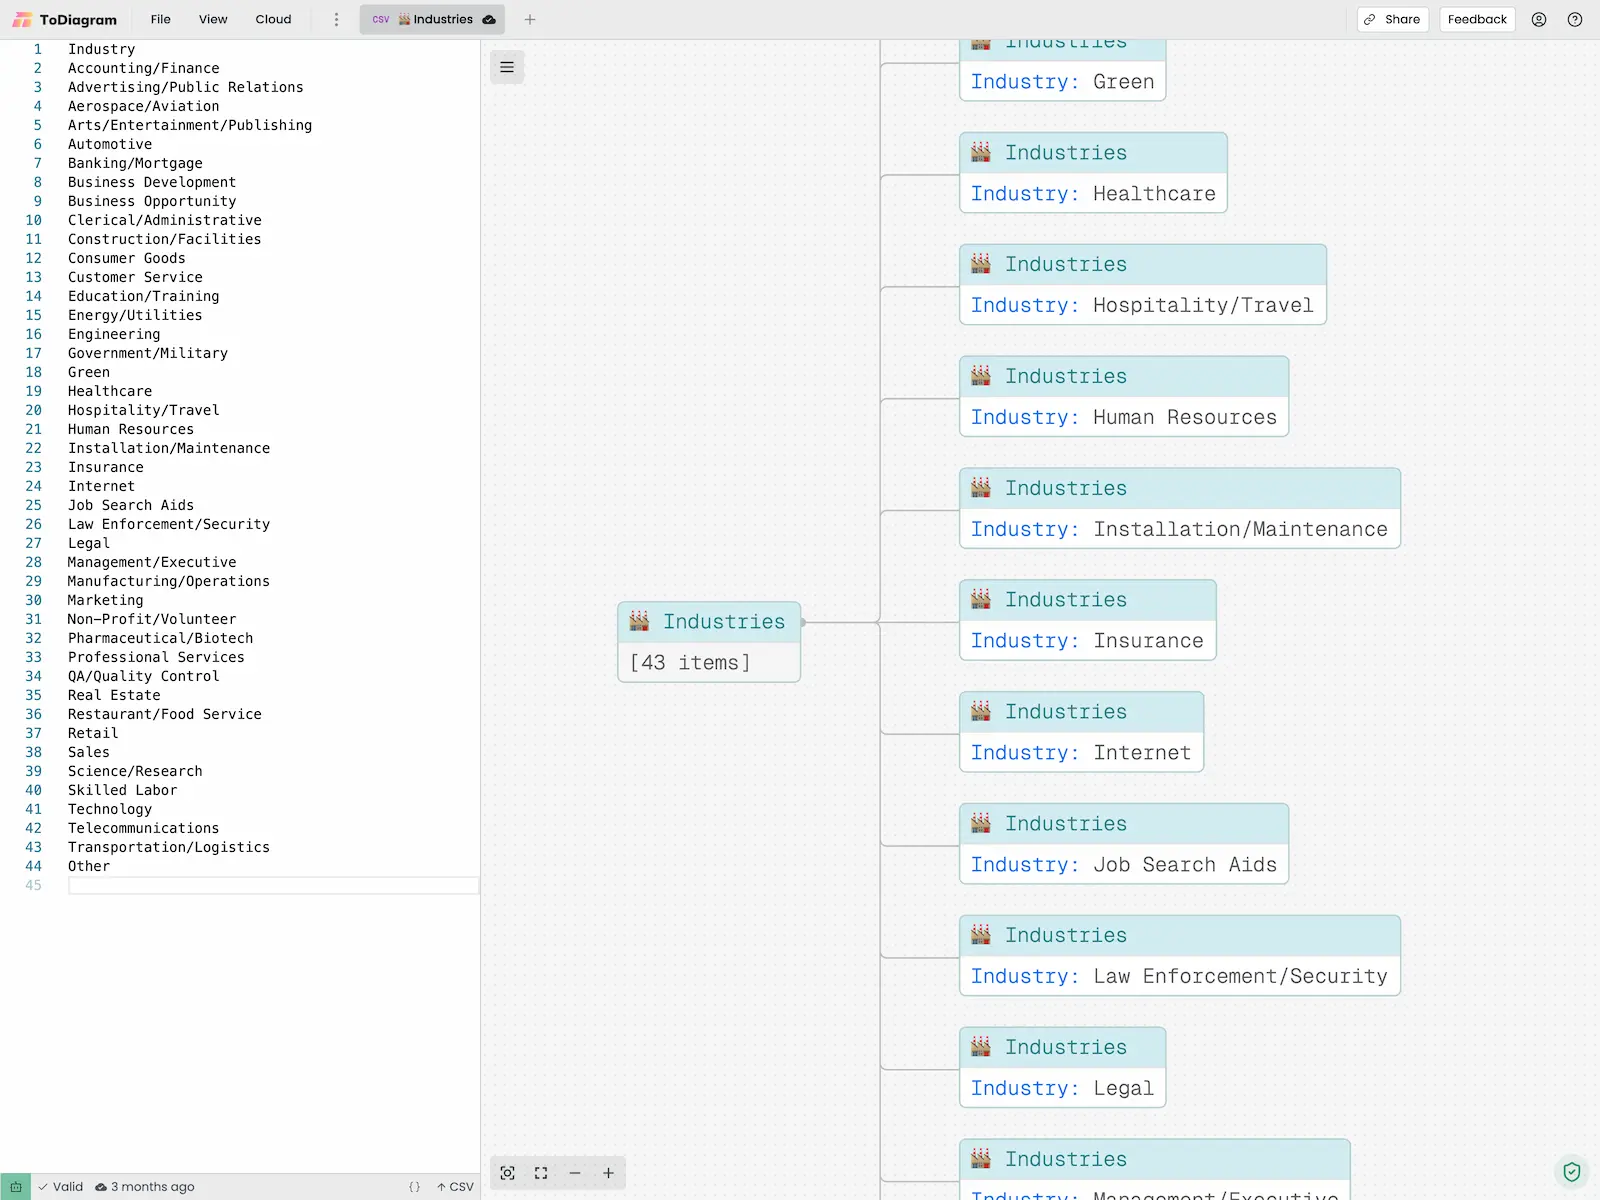
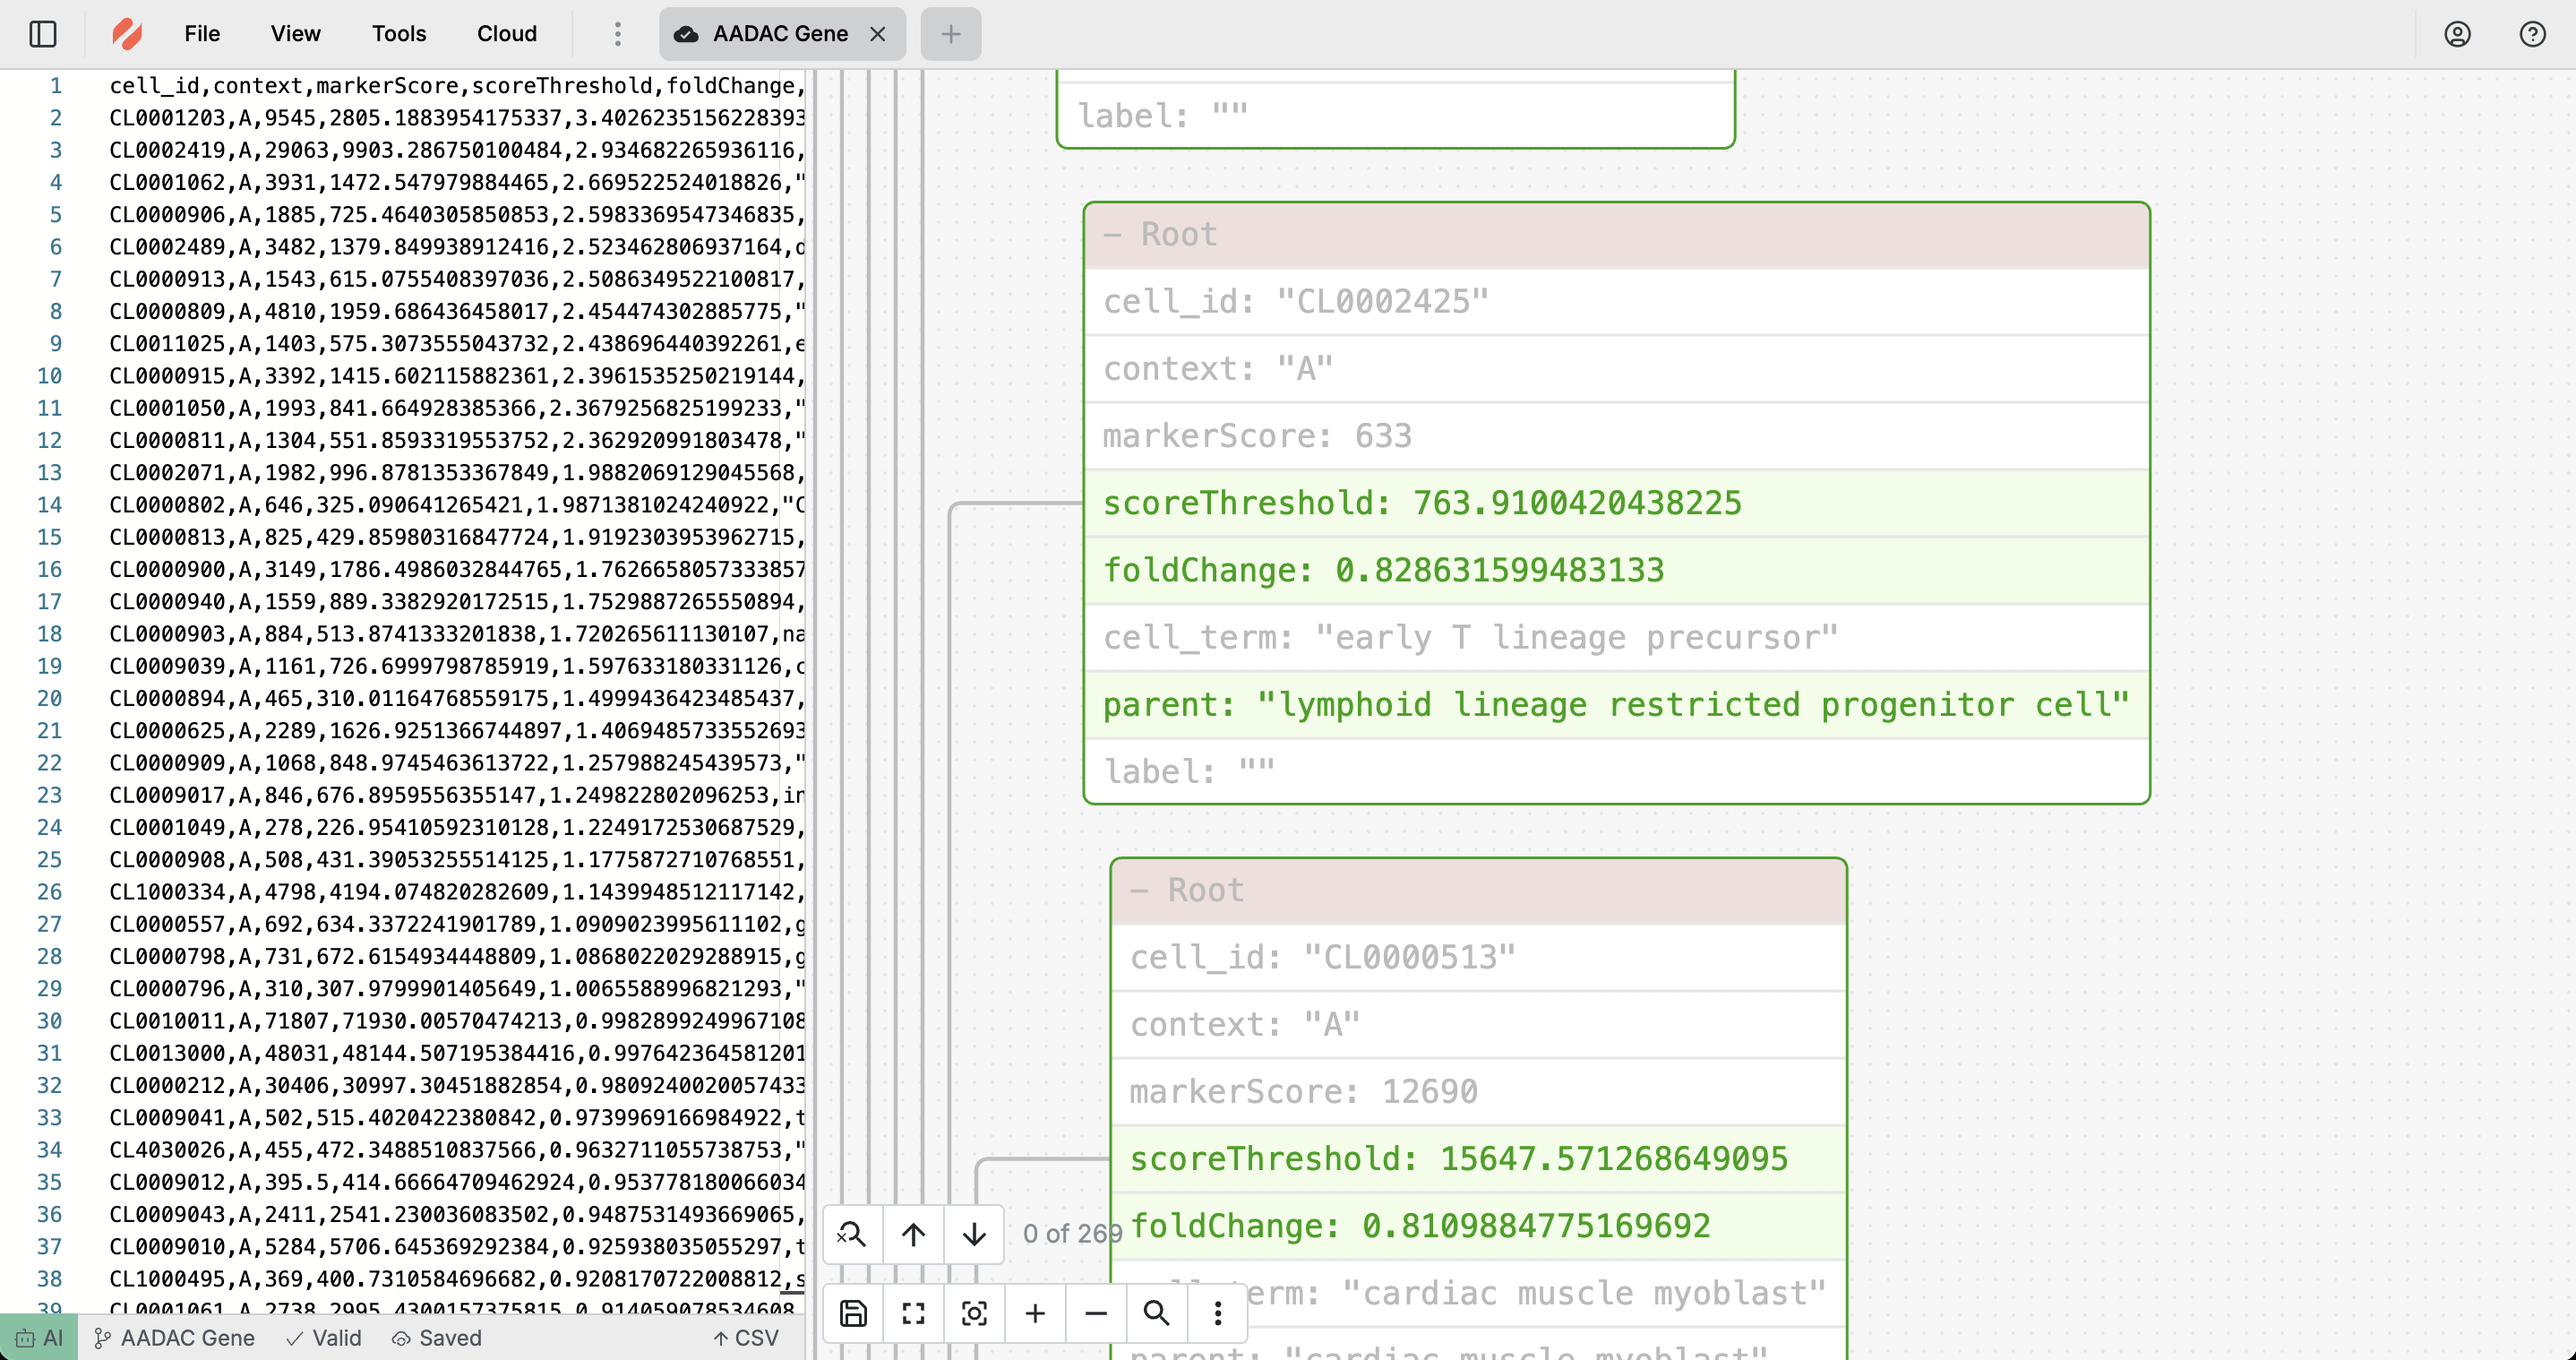
Visualize CSV structure
Turn rows and columns into an interactive CSV diagram so patterns and issues are easier to spot. See headers and relationships clearly without paging through spreadsheets.
Edit CSV with a live viewer
Use a fast CSV editor and viewer to update fields with full context. Changes reflect in the diagram so errors are easier to catch.
Understand rows and columns at a glance
See headers and fields visually so anomalies and outliers are obvious—no manual spreadsheet checks. Quickly validate schema and row consistency during QA.
Export and share
Export PNG/SVG for reports or share a link so stakeholders can explore the same dataset visually. Add diagrams to analyses and handoffs to reduce miscommunication.
Why ToDiagram is the best tool to visualize CSV files?
Cloud Storage
Store your data in the cloud, access it from anywhere, and share it with your team.

Text to Diagram AI
Convert your text descriptions into diagrams automatically, saving you time and effort in visualizing your data.
Powerful Visual Editing
Edit your data visually with our intuitive interface, making it easy to manage and manipulate your datasets.

Validate JSON Schema
Ensure your data adheres to the defined schema, preventing errors and ensuring data integrity. Easily identify and fix issues with our validation tools.
Frequently Asked Questions
Find questions and answers about our platform, services, and more.
More questions? Send us a message.