


Copy + Paste!
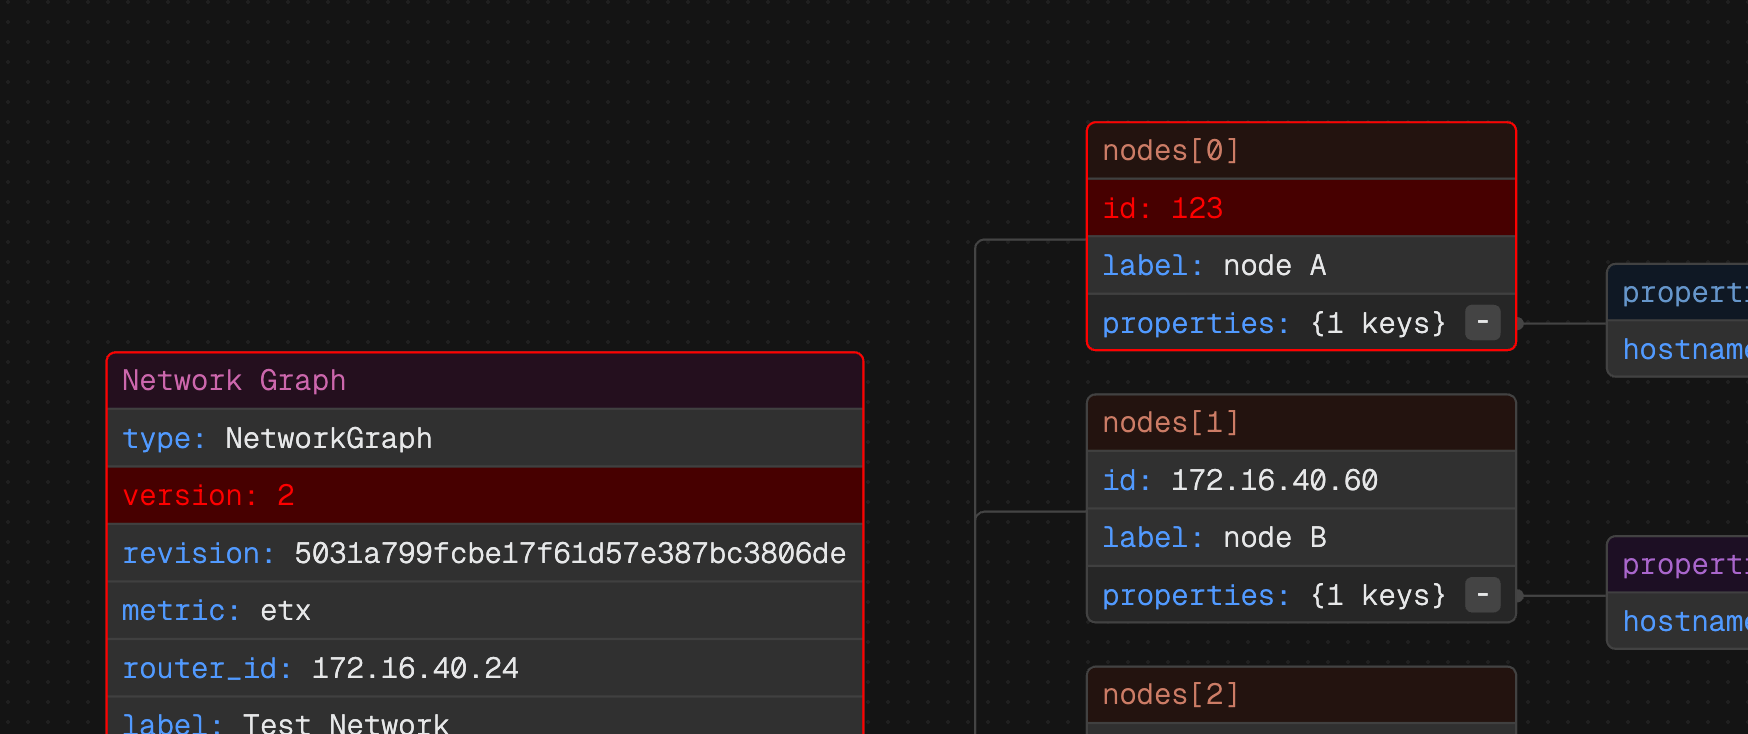
Cut, copy, and paste any node with a right-click—no complex shortcuts, no clutter. ToDiagram lets you restructure your data visually, making it easier to manage large JSON, YAML, or XML files with precision.
Start EditingSearch and filter in milliseconds.
Search and filter your data in milliseconds with the ToDiagram search bar. Instantly find and highlight specific nodes in your diagram, and filter by text, type, or relationship.
Try it nowAnywhere on the web.
Open and edit JSON, YAML, and other data formats directly from your browser with the ToDiagram Chrome Extension. Select any text on a webpage and instantly visualize it in an interactive diagram—no need to copy and paste.
Install Chrome ExtensionAt DynamicSource, we work with complex JSON files to define calculation algorithms for our performance applications. ToDiagram has been extremely helpful for visualizing complex logic and navigating deeply nested structures. Of all the tools we tried, ToDiagram is by far the most intuitive and powerful, making it much easier to work with our data.
Performance Engineering Lead, DynamicSource
Why ToDiagram is the best tool for data diagramming?
Cloud Storage
Store your data in the cloud, access it from anywhere, and share it with your team.

Text to Diagram AI
Convert your text descriptions into diagrams automatically, saving you time and effort in visualizing your data.
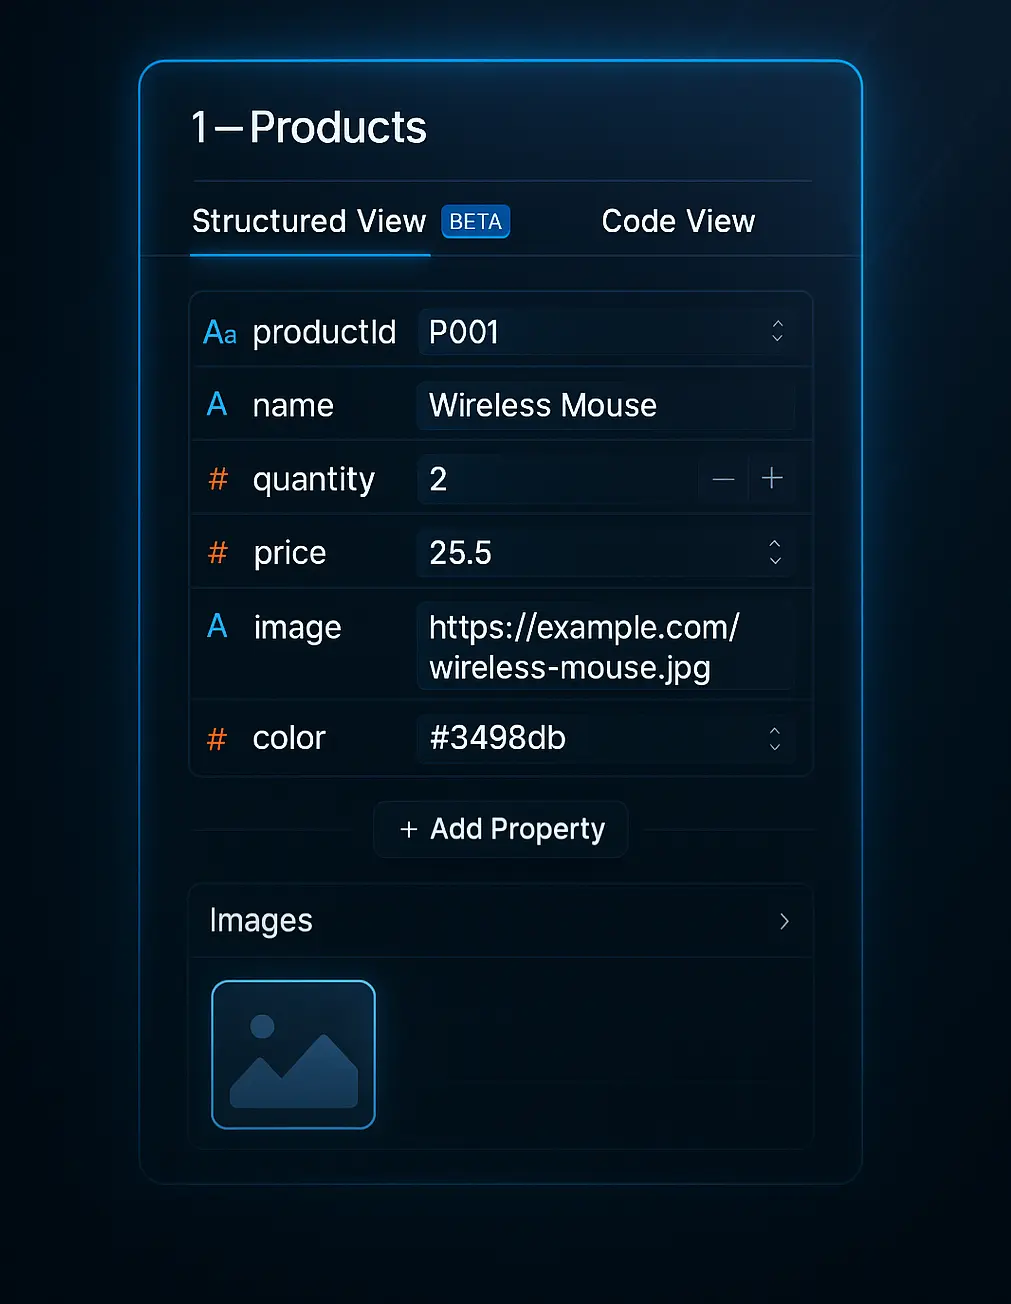
Powerful Visual Editing
Edit your data visually with our intuitive interface, making it easy to manage and manipulate your datasets.
Validate JSON Schema
Ensure your data adheres to the defined schema, preventing errors and ensuring data integrity. Easily identify and fix issues with our validation tools.
How to Convert JSON to Diagrams?
ToDiagram simplifies data visualization by converting formats like JSON, YAML, and more into interactive diagrams. This web-based tool lets you quickly analyze, edit, and share your data through dynamic diagrams, making complex structures easy to understand. No downloads required—work directly in your browser.
Visuals are processed 60,000x faster in the brain.
88% of users report improved clarity when working with data diagrams, while 74% find it accelerates decision-making. Interactive diagrams make it easier to manage and understand data, enhance collaboration, and improve efficiency. Whether for development, analysis, or design, transforming data into diagrams simplifies workflows and boosts productivity.
Real time. Visualize your data in real-time, no matter how complex.

Modify. Don't get lost in complex data. Edit them visually.

Customize. Change colors matching your branding.

Export. Share them with your team or embed in your documents. Export as PNG, JPEG or SVG.

Guides, Tips and News from ToDiagram
Visualizing Sitemaps as Diagrams
Turn sitemap.xml into a clear, interactive diagram to audit site structure, surface gaps, and share SEO insights fast.

ToDiagram 🤝 GitHub Education
ToDiagram is now part of the GitHub Student Developer Pack, giving students free access to powerful data visualization tools.
How to Build Custom Diagrams in ToDiagram
Learn how to define and visualize domain-specific data models using ToDiagram's Custom format, with configurable keys and nested structures.
Diagrams Under Lock and Key
Your Privacy. Our Priority.
ToDiagram processes all data locally in your browser, ensuring it never leaves your device. Your information remains private and secure, as no data is stored on our servers or shared with third parties.
Find out more →Frequently Asked Questions
Find questions and answers about our platform, services, and more.
More questions? Send us a message.