Getting Started
Learn how to use ToDiagram to visualize and edit your data in 5 simple steps
Transform your JSON, YAML, CSV, XML, and Mermaid data into interactive diagrams in minutes. This guide will walk you through the essential features of ToDiagram.
Quick Start Guide
Open the Editor
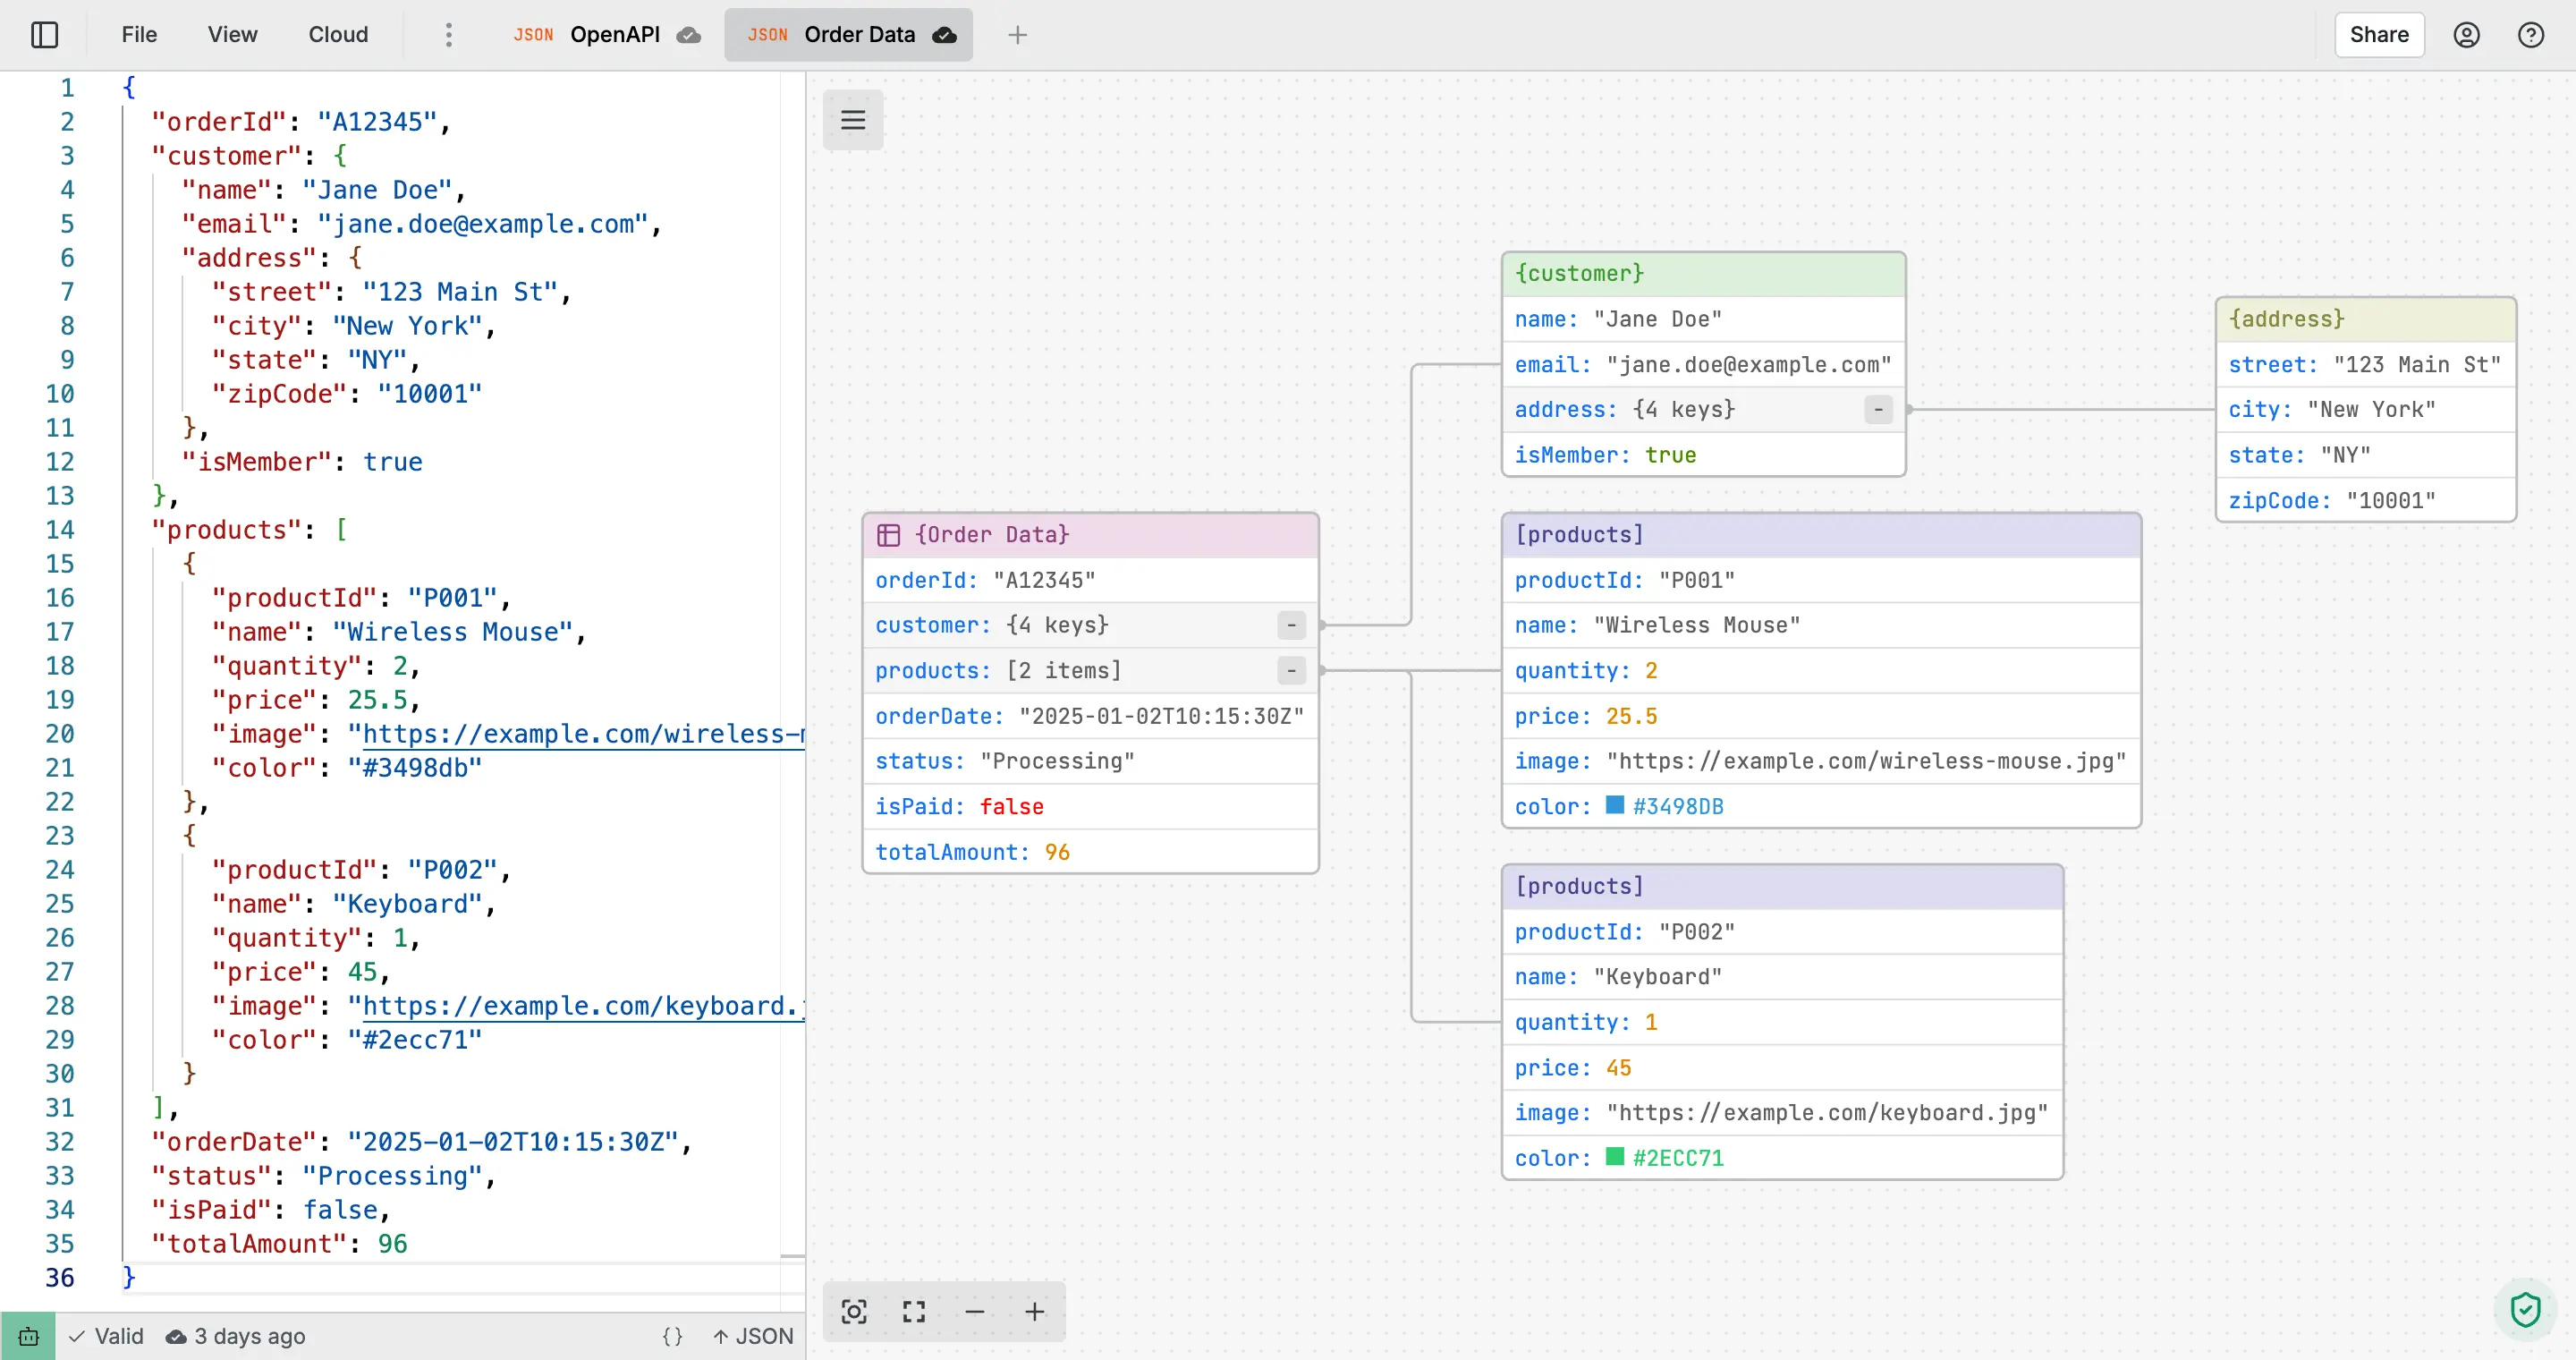
Visit todiagram.com/editor to access the interactive diagram editor. The editor opens with an example diagram to help you get started.
The editor interface includes:
- Top toolbar: File operations, tabs, sharing, and account options
- Main canvas: Interactive diagram visualization
- Text editor: Edit your data in real-time (optional pane)
- Bottom bar: Format selection, validation status, and cloud sync
Import Your Data
ToDiagram supports multiple ways to add your data:
Drag and Drop Files
Simply drag and drop your file onto the editor. Supported formats:
- JSON (
.json) - YAML (
.yaml,.yml) - XML (
.xml) - CSV (
.csv) - Mermaid (
.mmd)
Paste Data Directly
- Click anywhere in the text editor pane
- Paste your data (
Cmd/Ctrl + V) - The diagram updates automatically
Import from File Menu
- Click File → Open in the top toolbar
- Select your file
- Your data is loaded into a new tab
ToDiagram automatically detects the format of your data. All data processing happens in your browser for privacy.
Edit and Explore Diagrams
Once your data is visualized, you can interact with and modify your diagram:
Navigate the Canvas
- Pan: Click and drag the canvas background
- Zoom: Use mouse wheel or trackpad pinch
- Search: Press
Cmd/Ctrl + Fto find specific nodes - Focus: Double-click any node to center it
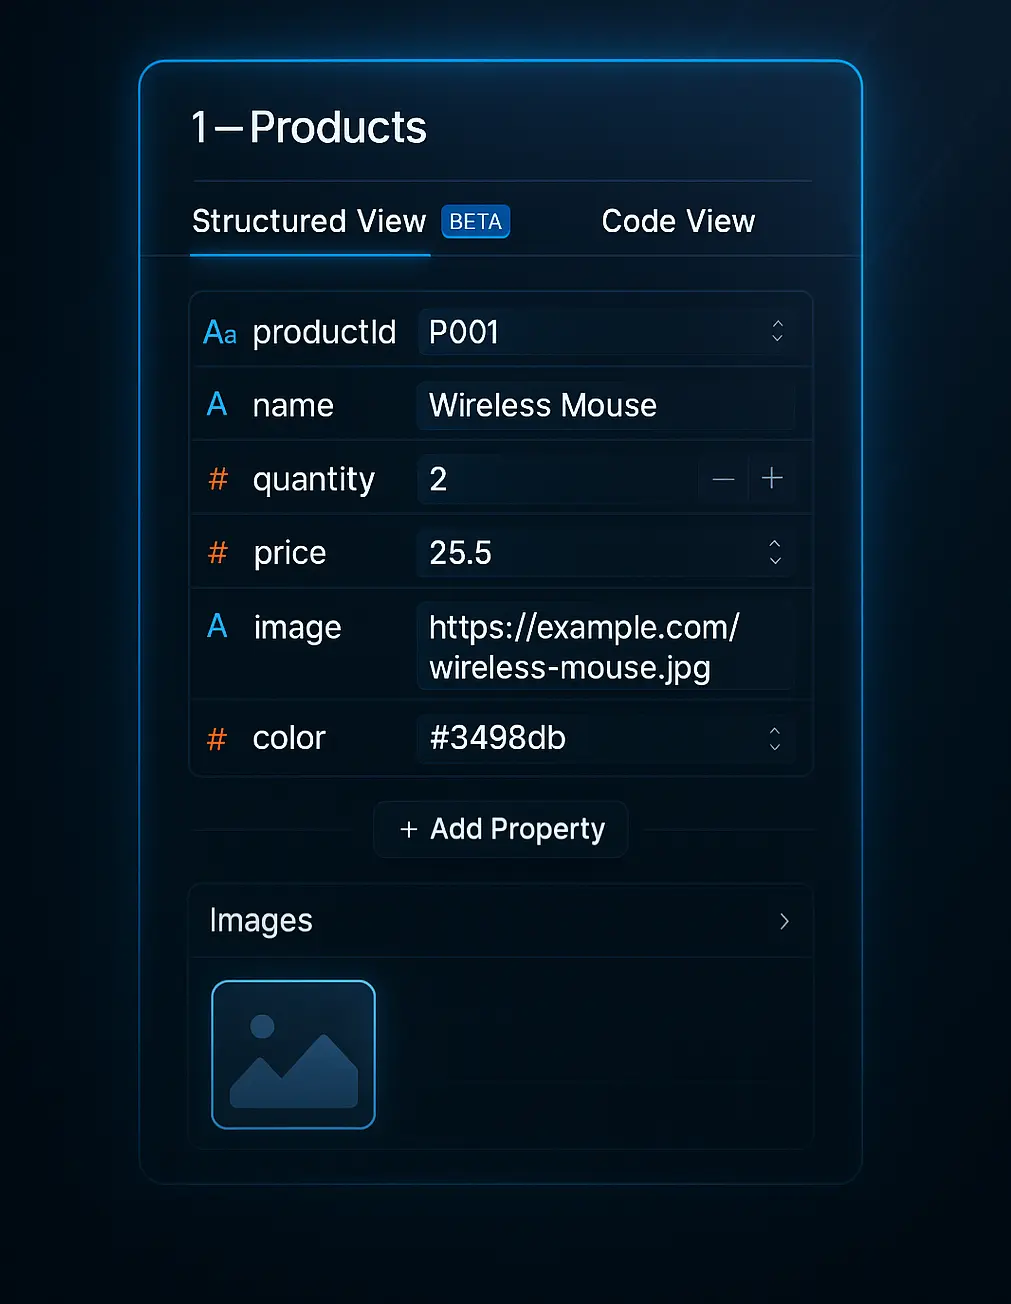
Modify Data Visually
- Edit Node: Click on any node to view and edit its data in a modal
- Copy/Paste: Right-click nodes for cut, copy, paste operations
- Delete: Select a node and press
Deleteor right-click → Delete - Expand/Collapse: Click the arrow icon on nodes with children
Edit in Text Editor
Changes in the text editor sync instantly with the diagram:
- Modify your data in the left pane
- The diagram updates in real-time
- Validation errors appear in the bottom bar
Use Cmd/Ctrl + Z to undo changes and Cmd/Ctrl + Shift + Z to redo.
Save to Cloud
Keep your work safe and accessible across devices by saving to the cloud:
First-Time Save
- Click the Cloud button in the top toolbar or the save icon in the bottom bar
- Sign in with GitHub or Google (if not already signed in)
- Your document is automatically saved
- A checkmark appears when saved successfully

Managing Saved Documents
- Click Cloud to open your documents library
- View all your saved diagrams
- Click any document to open it
- Use the search to find specific files
Collaboration Features
Share your diagrams with team members:
- Click the Share button in the top toolbar
- Set visibility to Public or Team
- Copy the shareable link
- Anyone with the link can view your diagram
Export as Image
Export your diagrams for presentations, documentation, or sharing:
Export Options
- Click the menu icon (☰) in the top-left of the canvas or press
Cmd/Ctrl + S - Select Export as image
- Configure your export:
- File Name: Name your export file
- Format: PNG, JPEG, or SVG (SVG requires Pro plan)
- Background: Choose a color or transparent background
- Scale: 1x, 2x, or 3x (3x requires Pro plan)
Export Methods
- Download: Save the image to your computer
- Copy to Clipboard: Click "Clipboard" to copy the image directly
PNG format with transparent background works best for most use cases. Use SVG for vector graphics that scale perfectly at any size.
Supported Export Formats
- PNG: Best for general use, supports transparency
- JPEG: Smaller file size, no transparency support
- SVG: Vector format for scalable graphics (Pro plan)
Next Steps
Need Help?
- Email: [email protected]
- Documentation: Browse our comprehensive guides
- Support: Use the feedback button in the editor
Start visualizing your data now at todiagram.com/editor!