Compare Data Visually
Compare structured data side-by-side on interactive diagrams. Highlight differences, track changes and review configs visually.
Trusted by 2500+ happy users worldwide
Used by professionals working at
Compare data in one click
Open each dataset in its own tab and choose Compare to get a visual diff online that highlights additions, removals and changes. Works for structured data like JSON, YAML, CSV and XML without extra setup.
Visual diff beats text diff
Diagram comparison makes nested structures easier to scan than line diffs—perfect for configs, API responses and tables. You see structure, not noise, so reviews are faster and clearer.
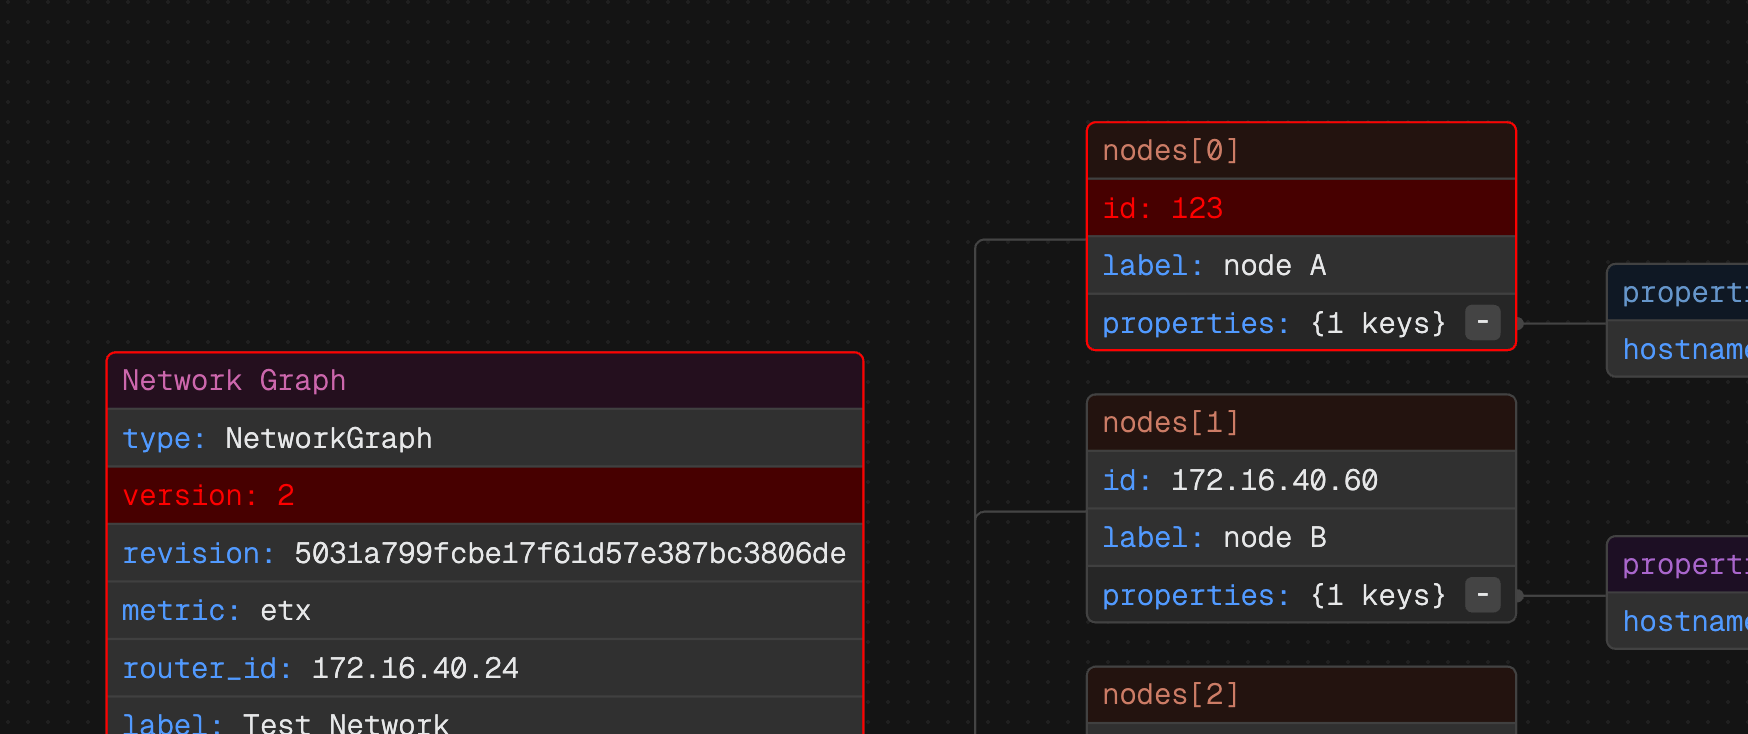
Spot changes quickly
See added, removed and modified values on nodes and edges so important updates stand out immediately. Hover to inspect exact keys, paths and values for precise context.
Export and share
Export PNG/SVG or share a link for fast reviews and sign-off. Attach visuals to PRs, tickets and docs to speed up decisions.
Why ToDiagram makes visual comparison easy
Cloud Storage
Store your data in the cloud, access it from anywhere, and share it with your team.

Text to Diagram AI
Convert your text descriptions into diagrams automatically, saving you time and effort in visualizing your data.
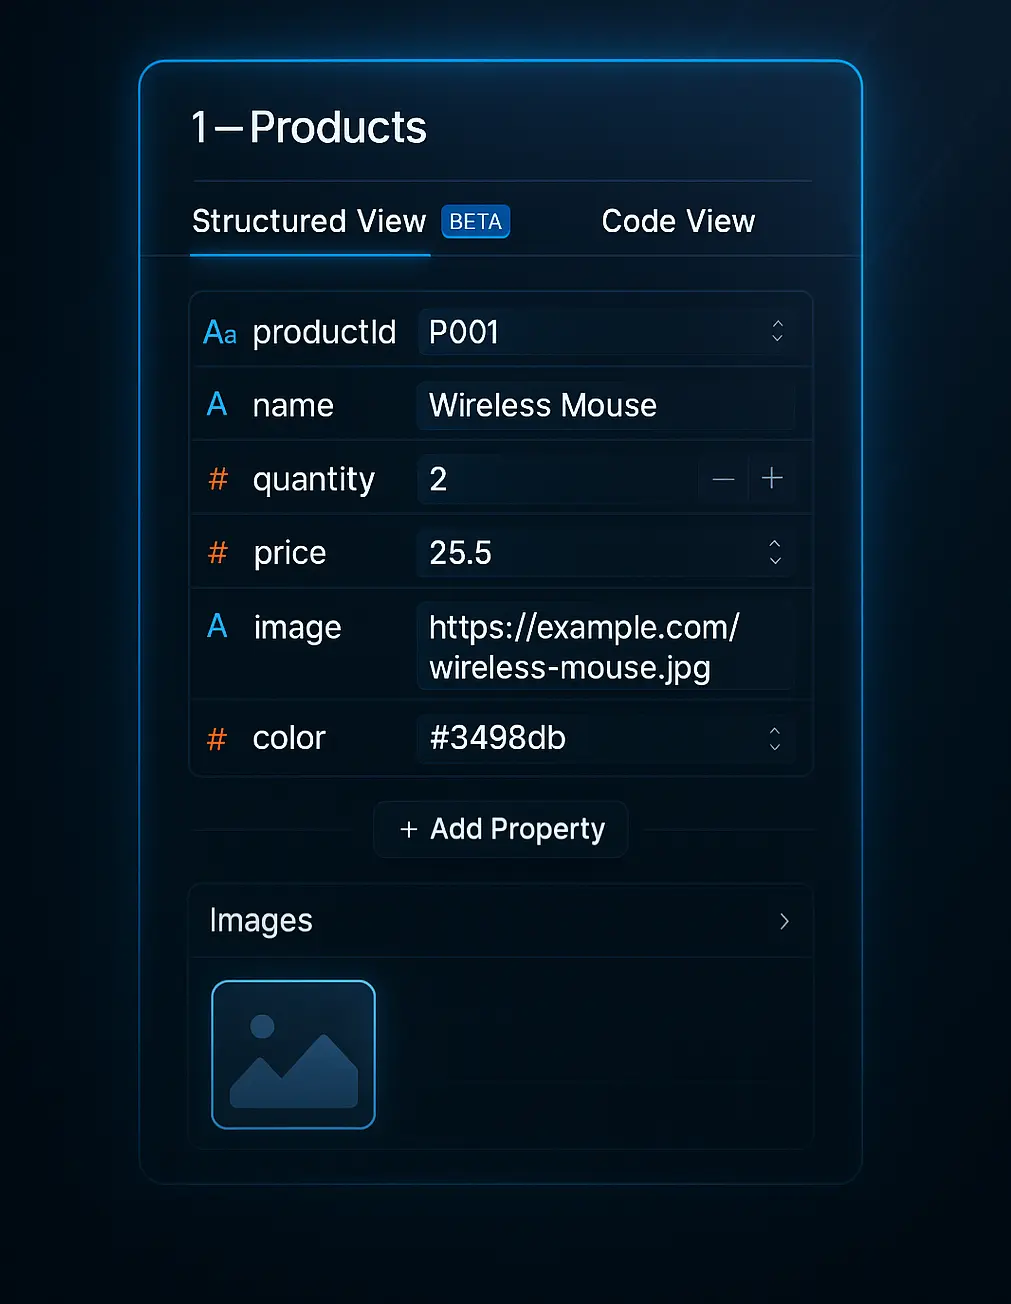
Powerful Visual Editing
Edit your data visually with our intuitive interface, making it easy to manage and manipulate your datasets.
Validate JSON Schema
Ensure your data adheres to the defined schema, preventing errors and ensuring data integrity. Easily identify and fix issues with our validation tools.
Compare Specific Formats
Jump straight to JSON diff, YAML compare, CSV compare, or XML diff pages.
Frequently Asked Questions
Find questions and answers about our platform, services, and more.
More questions? Send us a message.