Right Click
Copy + Paste!
Cut, copy, and paste any node with a right-click—no complex shortcuts, no clutter. ToDiagram lets you restructure your data visually, making it easier to manage large JSON, YAML, or XML files with precision.
Open EditorFind in diagram
Search and filter in milliseconds.
Search and filter your data in milliseconds with the ToDiagram search bar. Instantly find and highlight specific nodes in your diagram, and filter by text, type, or relationship.
Try it nowChrome Extension
Anywhere on the web.
Open and edit JSON, YAML, and other data formats directly from your browser with the ToDiagram Chrome Extension. Select any text on a webpage and instantly visualize it in an interactive diagram—no need to copy and paste.
Install Chrome ExtensionEverything you need to work with data efficiently
Chrome Extension
Select a text, right-click and open it directly on ToDiagram. No need to copy-paste.

AI Powered
Use AI to filter your data, restructure it, or even translate fields to another language.

Store on cloud
Save data in the cloud, access it from anywhere. Share it with other users.

Compare data
Compare two data, highlight differences. Whether it's JSON, XML, YAML or CSV.

Inspect nodes
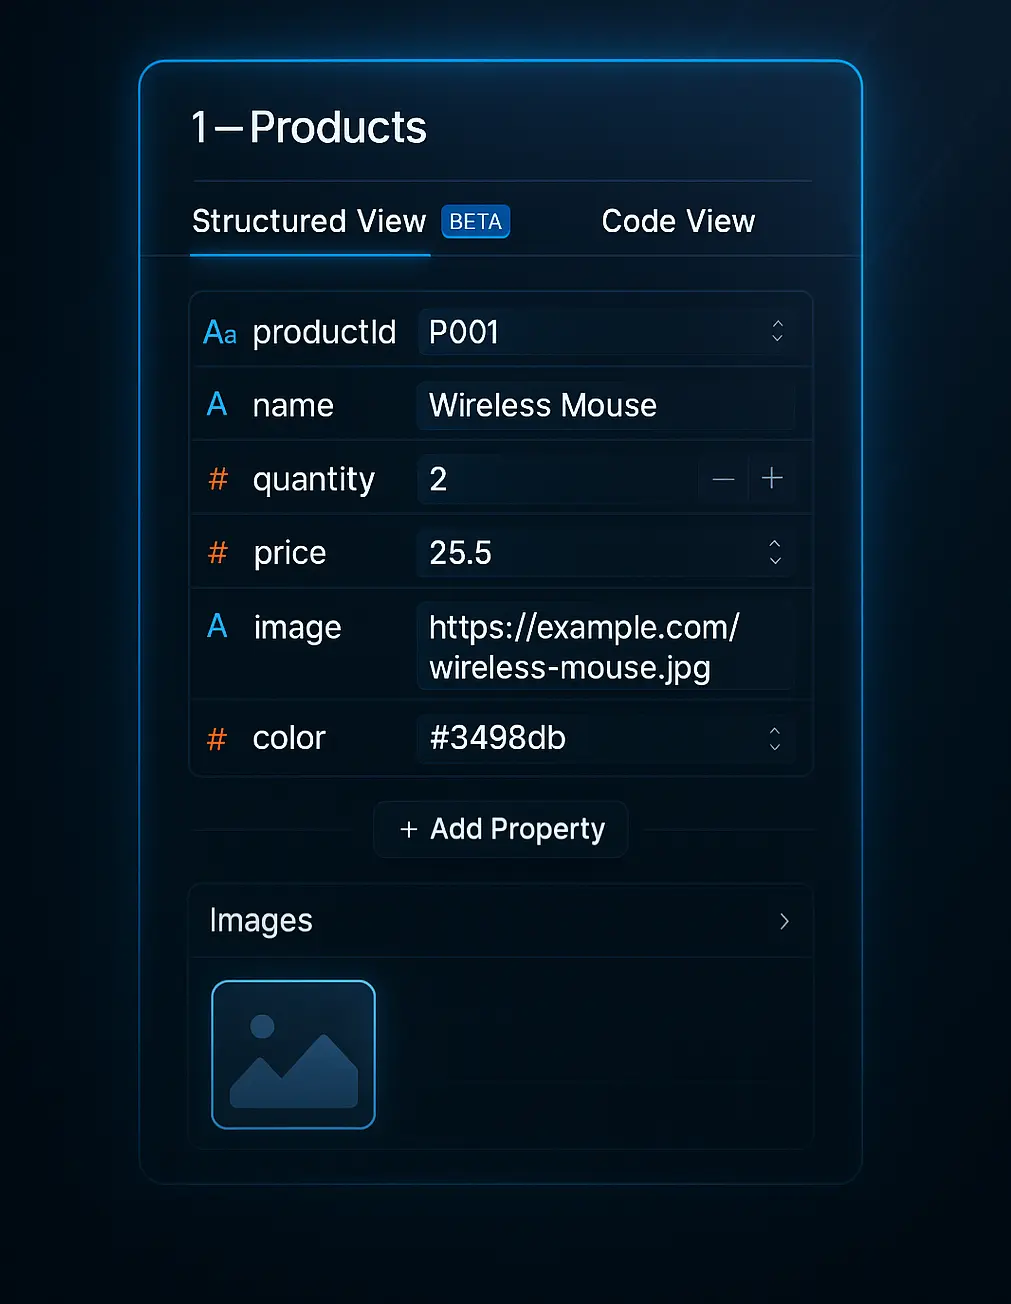
Easily navigate through arrays and objects, modify data, preview images and view JSON Path.

JSON to Diagrams
How to Convert JSON to Diagrams?
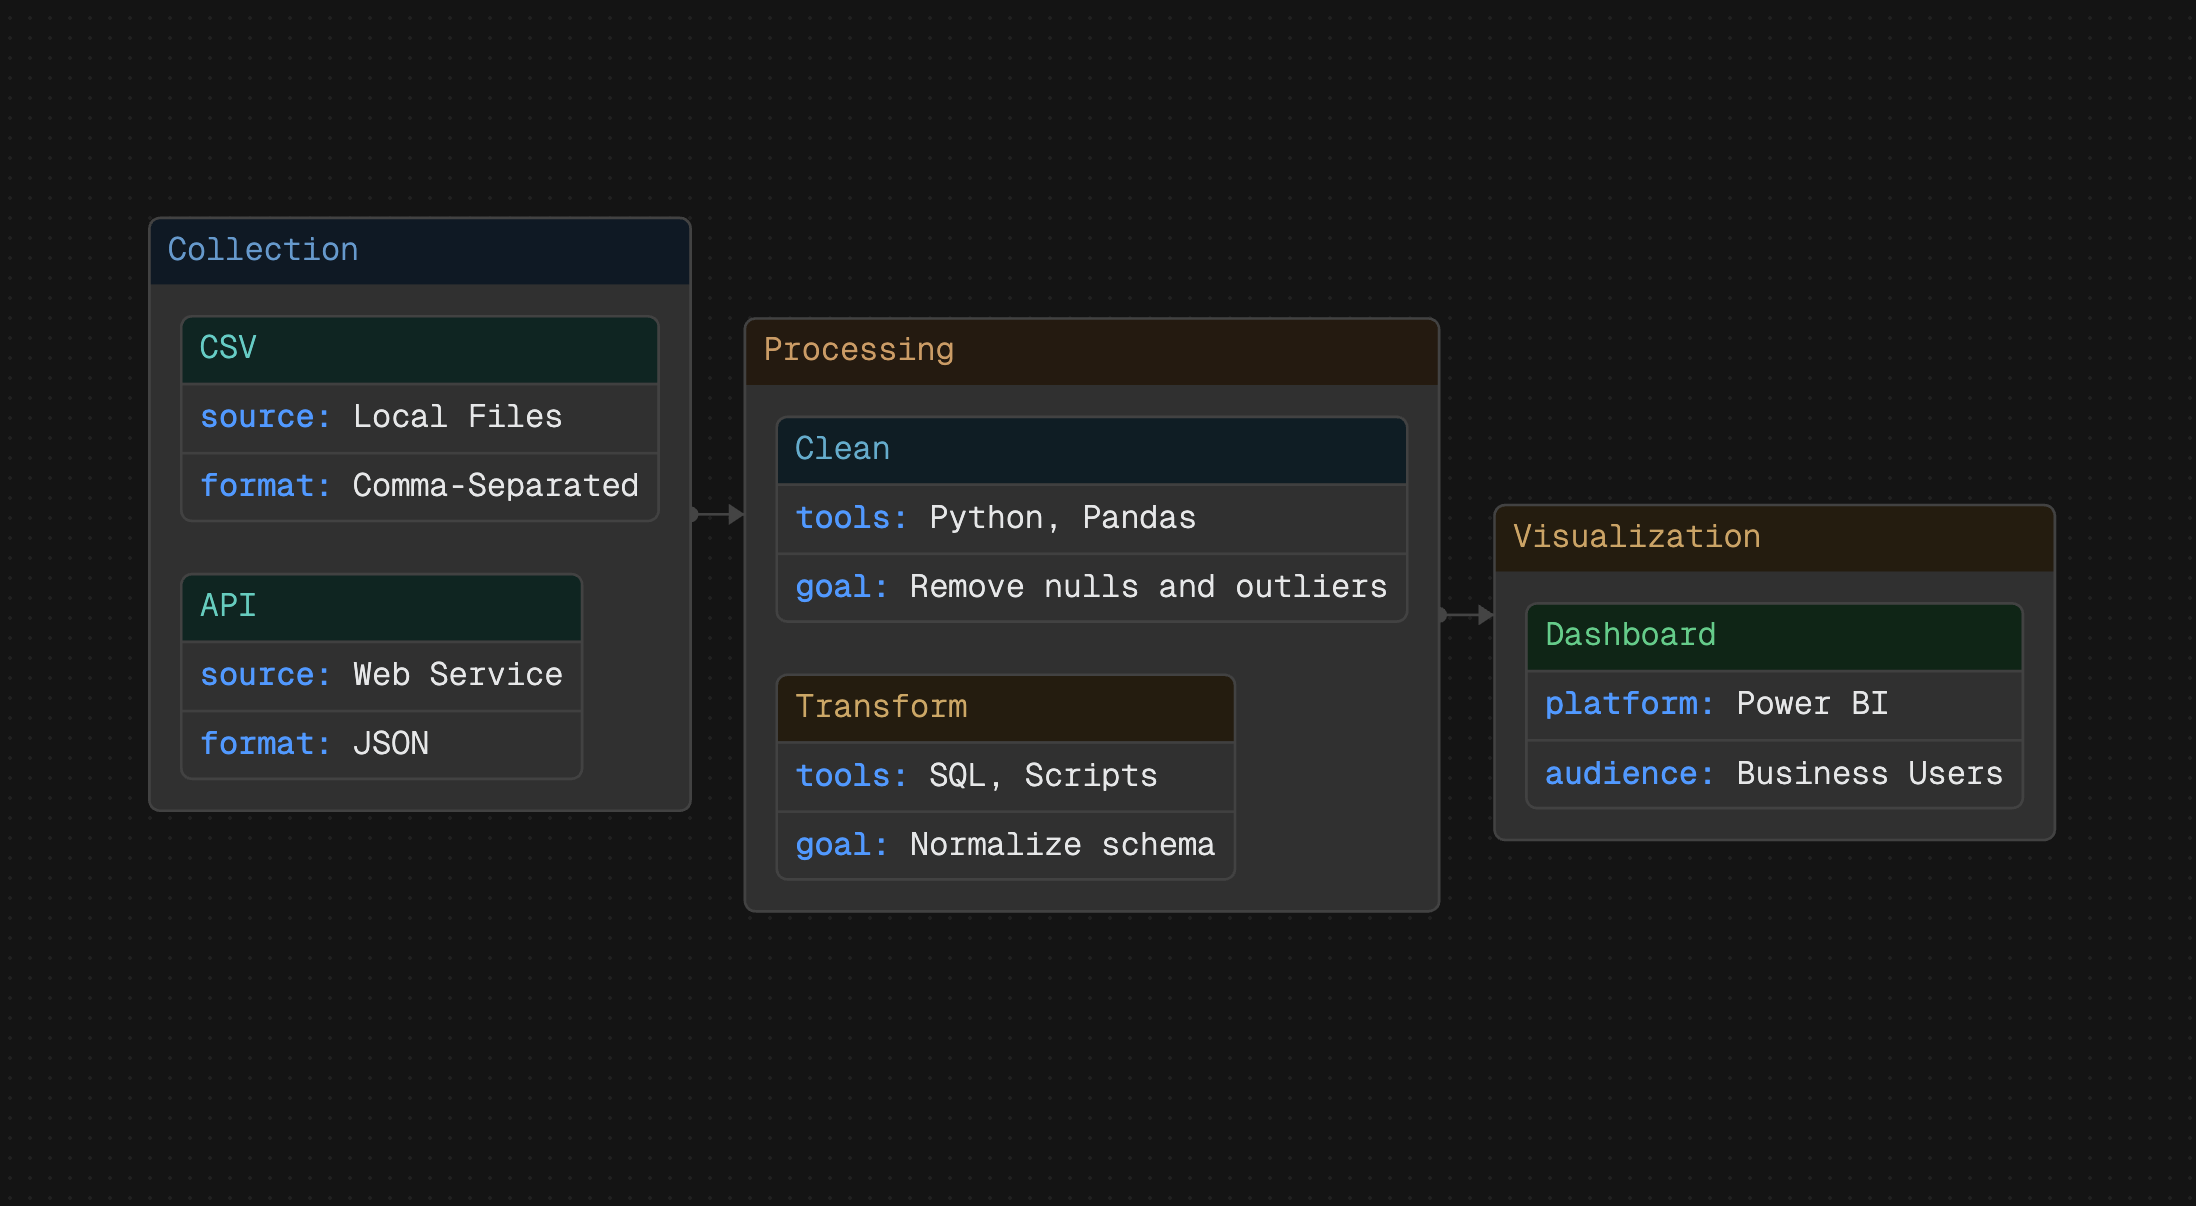
ToDiagram simplifies data visualization by converting formats like JSON, YAML, and more into interactive diagrams. This web-based tool lets you quickly analyze, edit, and share your data through dynamic diagrams, making complex structures easy to understand. No downloads required—work directly in your browser.
Why Are Interactive Diagrams Powerful?
Visuals are processed 60,000x faster in the brain.
88% of users report improved clarity when working with data diagrams, while 74% find it accelerates decision-making. Interactive diagrams make it easier to manage and understand data, enhance collaboration, and improve efficiency. Whether for development, analysis, or design, transforming data into diagrams simplifies workflows and boosts productivity.
Paste. Start working on the diagrams right away. Fast and easy.

Customize. Change colors matching your preferences or branding.

Modify. Don't get lost in complex data. Edit them visually.

Export. Share them with your team or embed in your documents.


Guides, Tips and News from ToDiagram

How to Create Custom Diagrams in ToDiagram
A practical guide to building your own diagram types and visualizations with ToDiagram.

Validate JSON Schema Right on the Diagrams
Validate JSON Schema visually with real-time feedback on interactive diagrams. Find and fix errors faster with schema-aware editing in ToDiagram.

Mastering jq: 10 Practical Commands to Transform and Query JSON Efficiently
Learn how to query, filter, and transform JSON data efficiently with jq. This guide covers 10 practical jq commands with clear examples you'll actually use in real projects.
Diagrams Under Lock and Key
Your Privacy.Our Priority.
ToDiagram processes all data locally in your browser, ensuring it never leaves your device. Your information remains private and secure, as no data is stored on our servers or shared with third parties.
Find out more →FAQ
Frequently Asked Questions
Find questions and answers about our platform, services, and more.
More questions? Send us a message.


